

Question: 1. The table and scatterplot below show the relationship between student enrollment (in thousands) and total number of property crimes (burglary and theft) in one
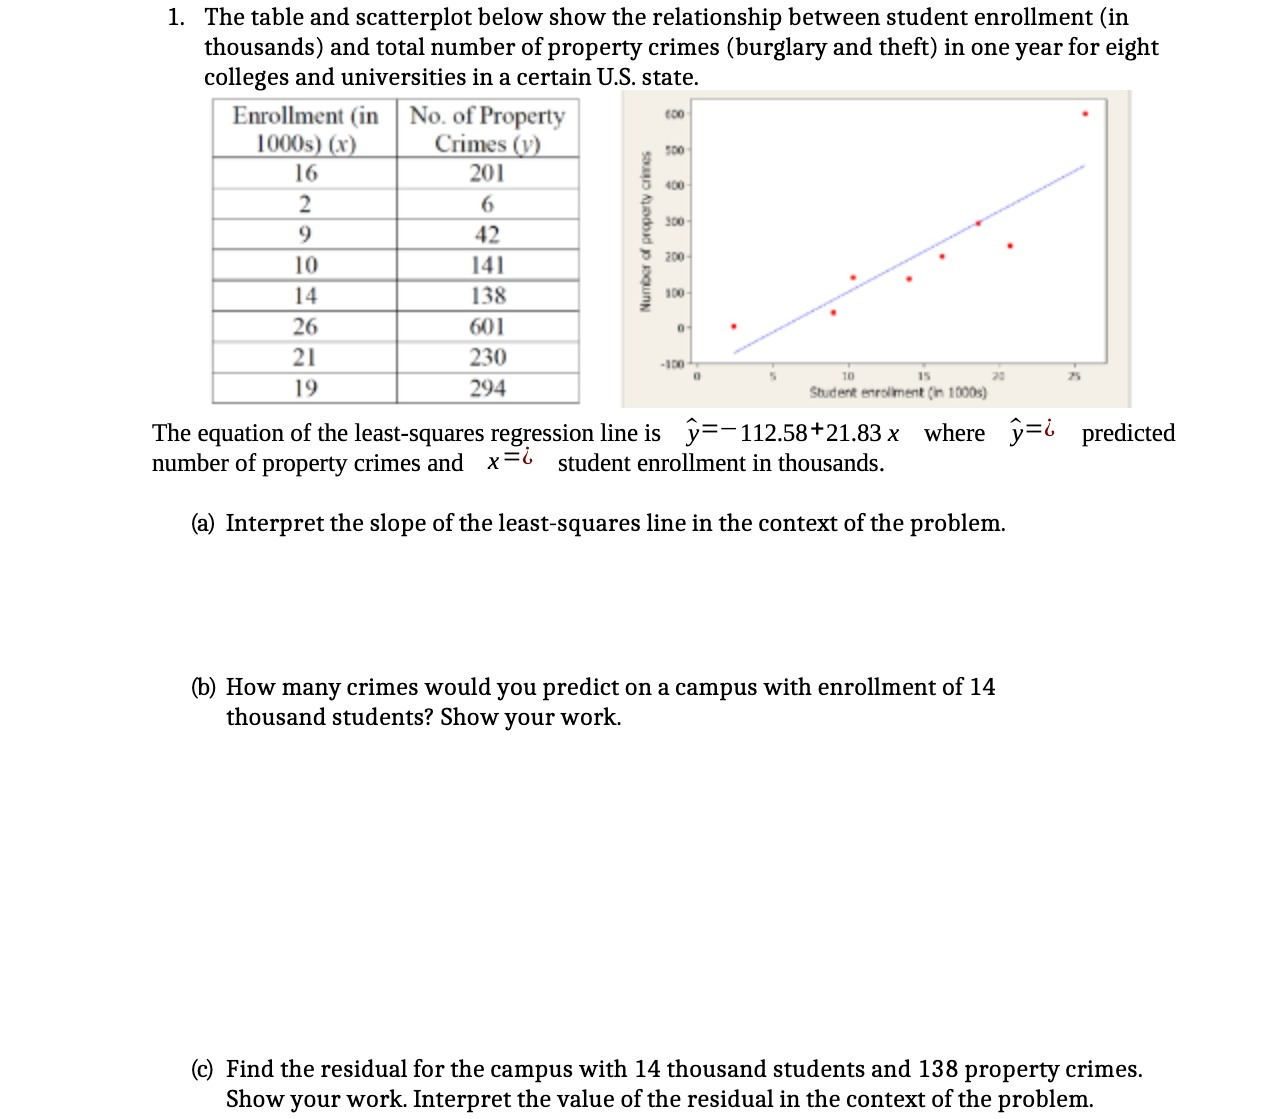
1. The table and scatterplot below show the relationship between student enrollment (in thousands) and total number of property crimes (burglary and theft) in one year for eight colleges and universities in a certain US. state. Emollmcnl (in No. of Property \"I - Mills 1' Crimes r m | E- 2 6 .- 42 E\" _. . -_ m \"- -1- us i "- 26 60! . . -_ 294 ' ' msm'im" " The equation of the least-squares regression line is SF 112.58+21.83 x. where 37:3 predicted number of property crimes and x :6 student enrollment in thousands. (a) Interpret the slope of the least-squares line in the context of the problem. (b) How many crimes would you predict on a campus with enrollment of 14 thousand students? Show your work. (c) Find the residual for the campus with 14 thousand students and 138 property crimes. Show your work. Interpret the value of the residual in the context of the
Step by Step Solution
There are 3 Steps involved in it

Get step-by-step solutions from verified subject matter experts