

Question: 1. The table below describes traffic on a congestible freeway. Plot and label the marginal social cost (MC), average private cost (AC), and demand
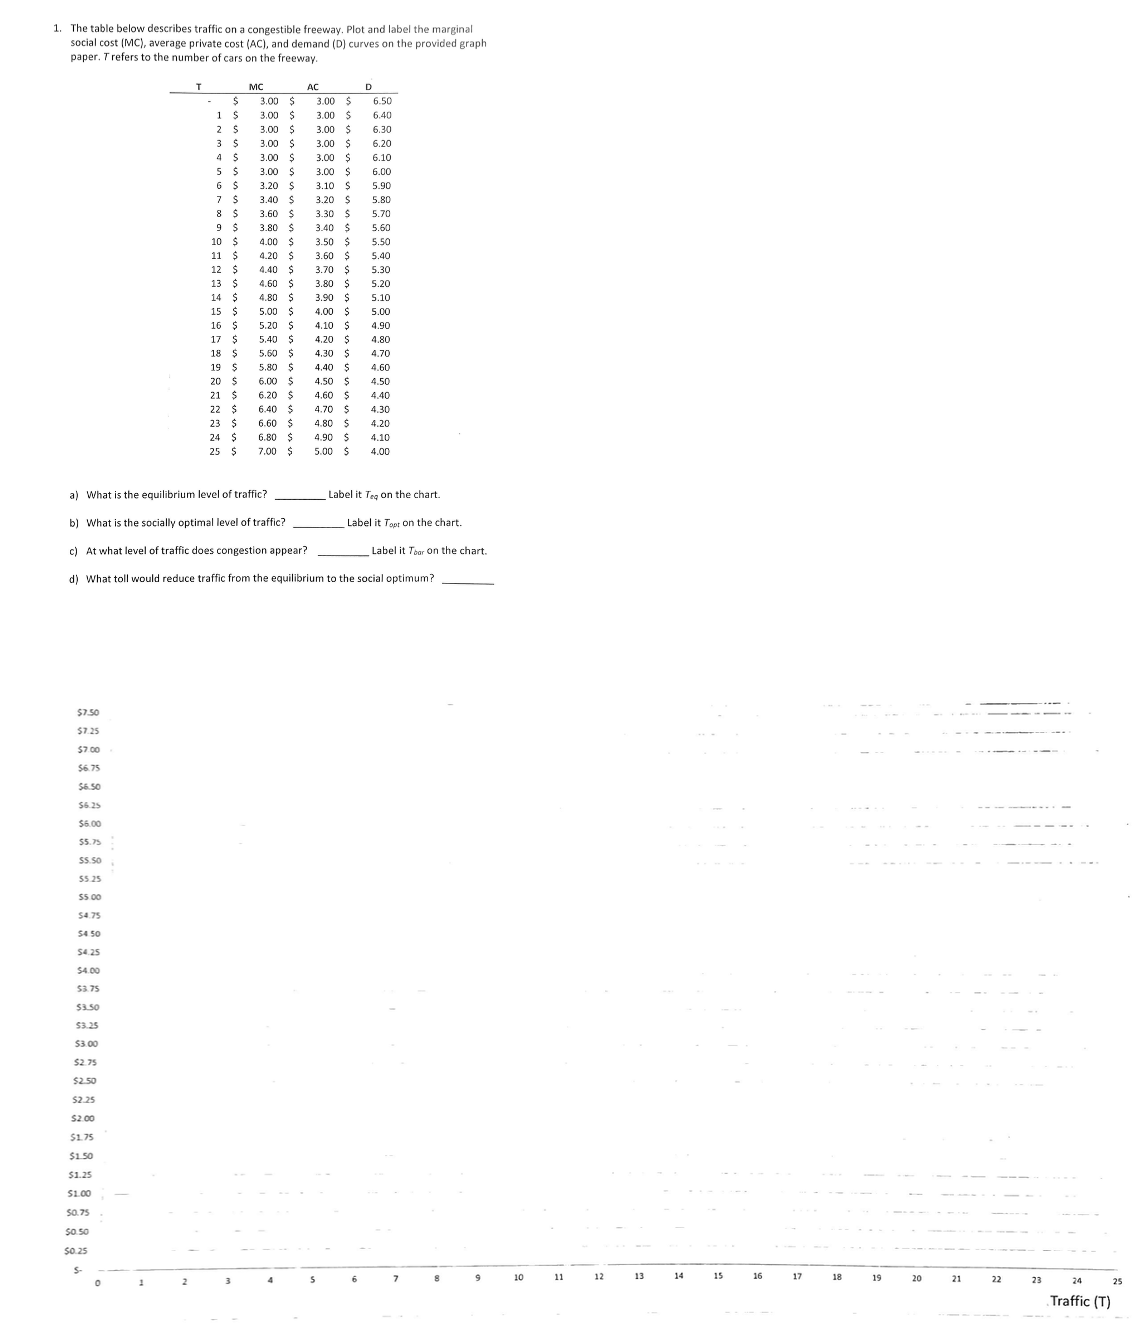
1. The table below describes traffic on a congestible freeway. Plot and label the marginal social cost (MC), average private cost (AC), and demand (D) curves on the provided graphi paper. 7 refers to the number of cars on the freeway. T MC AC D S 3.00 $ 3.00 $ 1 S 3.00 $ 3.00 S 6.50 6.40 S 3.00 $ 3.00 S 6.30 3 $ 3.00 $ 3.00 $ 6.20 4 S 3.00 $ 3.00 $ 6.10 5 S 3.00 $ 3.00 $ 6.00 6 $ 3.20 $ 3.10 $ 5.90 7 $ 3.40 $ 3.20 $ 5.80 8 $ 3.60 $ 3.30 $ 5.70 9 $ 3.80 $ 3.40 $ 5.60 10 $ 4.00 $ 3.50 $ 5.50 11 $ 4.20 $ 3.60 S 5.40 12 $ 4.40 $ 3.70 $ 5.30 13 $ 4.60 $ 3.80 $ 5.20 14 $ 4.80 $ 3.90 $ 5.10 15 $ 5.00 $ 4.00 $ 5.00 16 $ 5.20 4.10 S 4.90 17 $ 5.40 $ 4.20 S 4.80 18 $ 5.60 $ 4.30 $ 4.70 19 $ 5.80 $ $ 4.60 20 $ 6.00 $ 4.50 $ 4.50 21 $ 6.20 $ 4.60 $ 4.40 22 $ 6.40 $ 4.70 $ 4.30 23 $ 6.60 $ 4.80 $ 4.201 24 $ 6.80 $ 4.90 $ 4.10 25 $ 7.00 $ 5.00 $ 4.00 a) What is the equilibrium level of traffic? b) What is the socially optimal level of traffic? c) At what level of traffic does congestion appear? Label it Teg on the chart. Label it Topt on the chart. Label it Tbar on the chart. d) What toll would reduce traffic from the equilibrium to the social optimum? $7.50 $7.25 $7.00 $6.75 $6.50 $6.25 $6.00 $5.75 $5.50 55.25 $5.00 $4.75 $4.50 $4.25 $4.00 53.75 $3.50 $3.25 $3.00 $2.75 $2.50 $2.25 $2.00 $1.75 $1.50 $1.25 $1.00 50.75 $0.50 $0.25 S 8 9 10 11 12 14 15 16 17 18 19 20 21 22 23 24 25 Traffic (T)
Step by Step Solution
There are 3 Steps involved in it

Get step-by-step solutions from verified subject matter experts