

Question: 1. The table below shows data for real and nominal GDP for a hypothetical economy over several years Please Show the full calculation work clearly

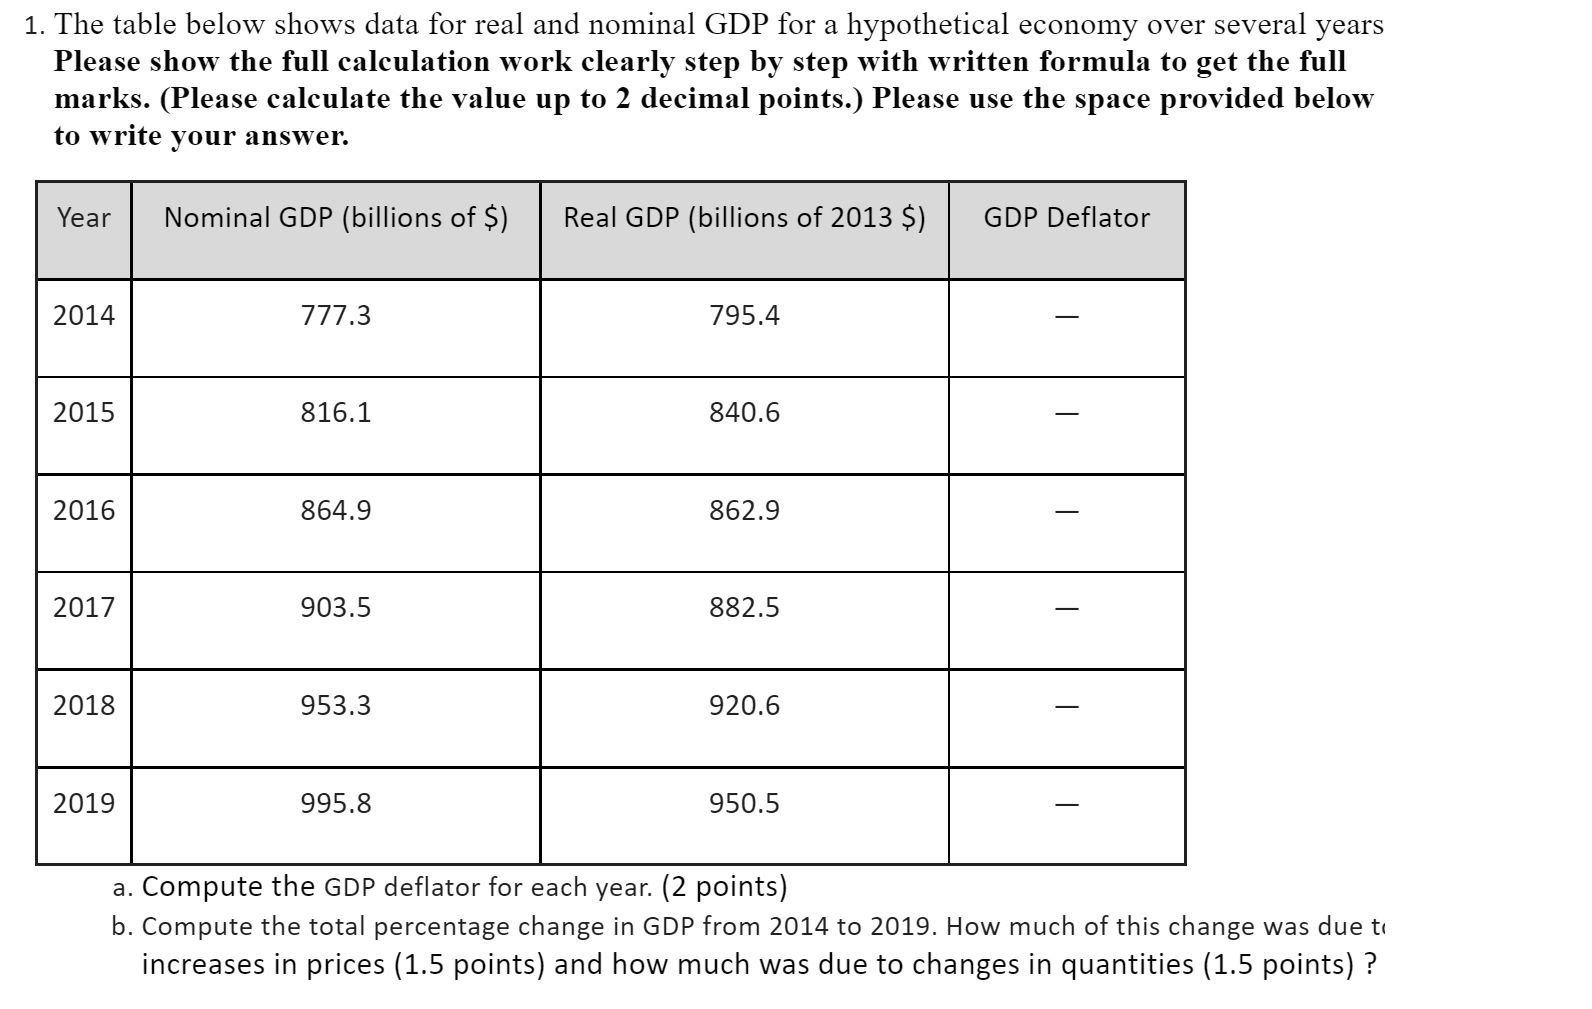
1. The table below shows data for real and nominal GDP for a hypothetical economy over several years Please Show the full calculation work clearly step by step with written formula to get the full marks. (Please calculate the value up to 2 decimal points.) Please use the space provided below to write your answer. Nominal GDP (billions of $) Real GDP {billions of 2013 5) GDP Deflator 2014 777.3 795.4 - 2015 816.1 840.6 - l__- l__- l__- l__- a. Compute the GDP deflator for each year.( (2 points) b. Compute the total percentage change in GDP from 2014 to 2019. How much of this change was due t: increases in prices (1.5 points) and how much was due to changes in quantities (1.5 points)
Step by Step Solution
There are 3 Steps involved in it

Get step-by-step solutions from verified subject matter experts