

Question: 1) The table below shows the demand schedule for museum admissions in a small city Quantity Demanded Price (thousands of (per visit person-visits per per
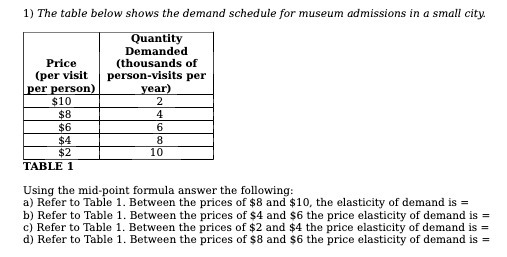
1) The table below shows the demand schedule for museum admissions in a small city Quantity Demanded Price (thousands of (per visit person-visits per per person) year) $10 2 $8 4 $6 6 $4 8 $2 10 TABLE 1 Using the mid-point formula answer the following: a) Refer to Table 1. Between the prices of $8 and $10, the elasticity of demand is = b) Refer to Table 1. Between the prices of $4 and $6 the price elasticity of demand is = c) Refer to Table 1. Between the prices of $2 and $4 the price elasticity of demand is = d) Refer to Table 1. Between the prices of $8 and $6 the price elasticity of demand is =
Step by Step Solution
There are 3 Steps involved in it
1 Expert Approved Answer
Step: 1 Unlock

Question Has Been Solved by an Expert!
Get step-by-step solutions from verified subject matter experts
Step: 2 Unlock
Step: 3 Unlock