

Question: 1. The table below shows the relationship between the price of good X and the quantity demanded for good X and Y. Price of good
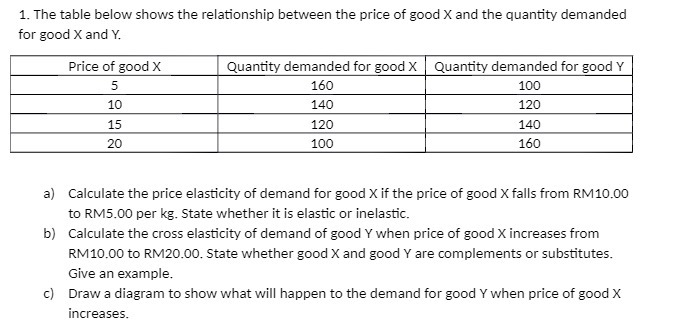
1. The table below shows the relationship between the price of good X and the quantity demanded for good X and Y. Price of good X Quantity demanded for good X Quantity demanded for good Y 5 160 100 10 140 120 15 120 140 20 100 160 a) Calculate the price elasticity of demand for good X if the price of good X falls from RM10.00 to RM5.00 per kg. State whether it is elastic or inelastic. b) Calculate the cross elasticity of demand of good Y when price of good X increases from RM10.00 to RM20.00. State whether good X and good Y are complements or substitutes. Give an example. c) Draw a diagram to show what will happen to the demand for good Y when price of good X increases
Step by Step Solution
There are 3 Steps involved in it

Get step-by-step solutions from verified subject matter experts