

Question: 1. The table below shows the relationship between the price of apple fritters and the number of apple fritters that Dan buys per week.
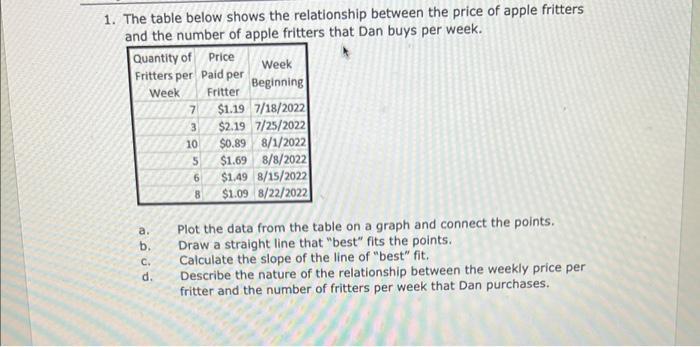
1. The table below shows the relationship between the price of apple fritters and the number of apple fritters that Dan buys per week. Quantity of Price Fritters per Paid per Week Beginning Week Fritter 7 $1.19 7/18/2022 3 $2.19 7/25/2022 10 $0.89 8/1/2022 5 $1.69 8/8/2022 6 $1.49 8/15/2022 8 $1.09 8/22/2022 a. b. Plot the data from the table on a graph and connect the points. Draw a straight line that "best" fits the points. C. d. Calculate the slope of the line of "best" fit. Describe the nature of the relationship between the weekly price per fritter and the number of fritters per week that Dan purchases.
Step by Step Solution
There are 3 Steps involved in it

Get step-by-step solutions from verified subject matter experts