

Question: 1. The table blow shows the data from Modified Atwood's Machine (Lab#4*) for y= 0.42 m (42 cm) and various different hanging masses (the system
1.
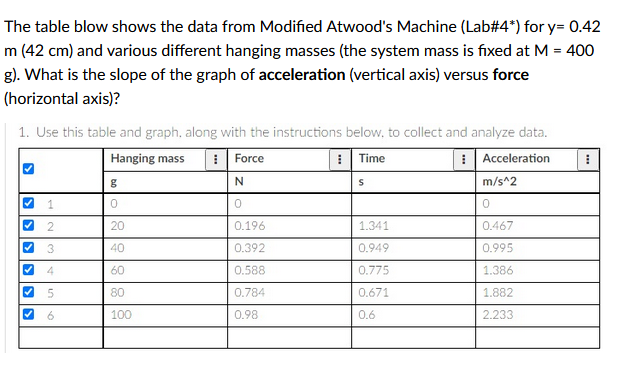
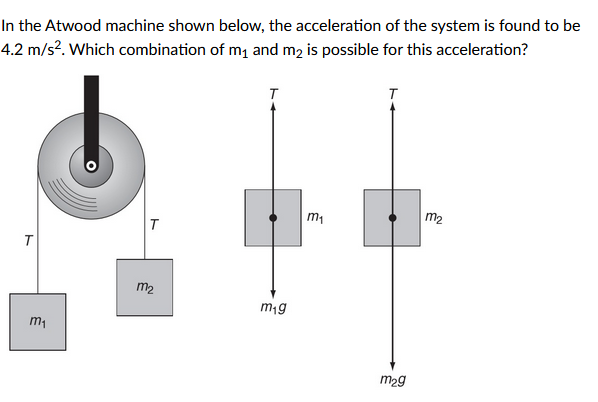
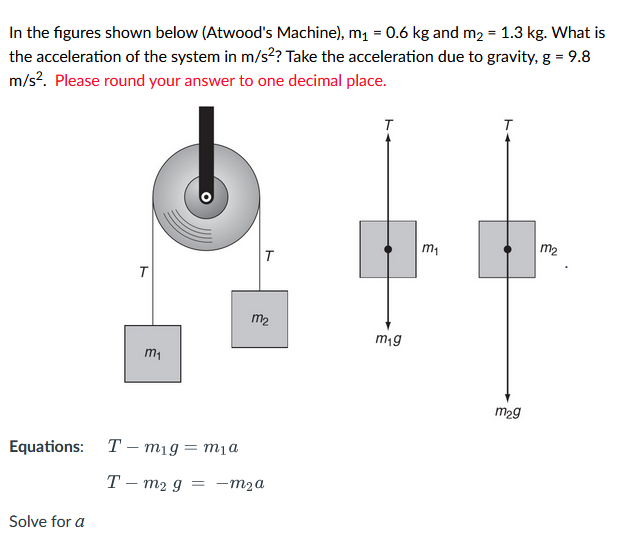
The table blow shows the data from Modified Atwood's Machine (Lab#4*) for y= 0.42 m (42 cm) and various different hanging masses (the system mass is fixed at M = 400 g). What is the slope of the graph of acceleration (vertical axis) versus force (horizontal axis)? 1. Use this table and graph. along with the instructions below. to collect and analyze data. Hanging mass Force Time Acceleration N S m/s*2 2 20 0.196 1.341 0.467 3 40 0.392 0.949 0.995 4 60 0.588 0.775 1.386 5 80 0.784 0.671 1.882 6 100 0.98 0.6 2.233In the Atwood machine shown below, the acceleration of the system is found to be 4.2 m/s2. Which combination of my and my is possible for this acceleration? O M2 m1 T T m2 m1 magIn the figures shown below (Atwood's Machine), m1 = 0.6 kg and m2 = 1.3 kg. What is the acceleration of the system in m/s? Take the acceleration due to gravity, g = 9.8 m/s2. Please round your answer to one decimal place. M1 M2 T T m2 mg m1 mag Equations: T - mig = mia T - mag = -mza Solve for a
Step by Step Solution
There are 3 Steps involved in it

Get step-by-step solutions from verified subject matter experts