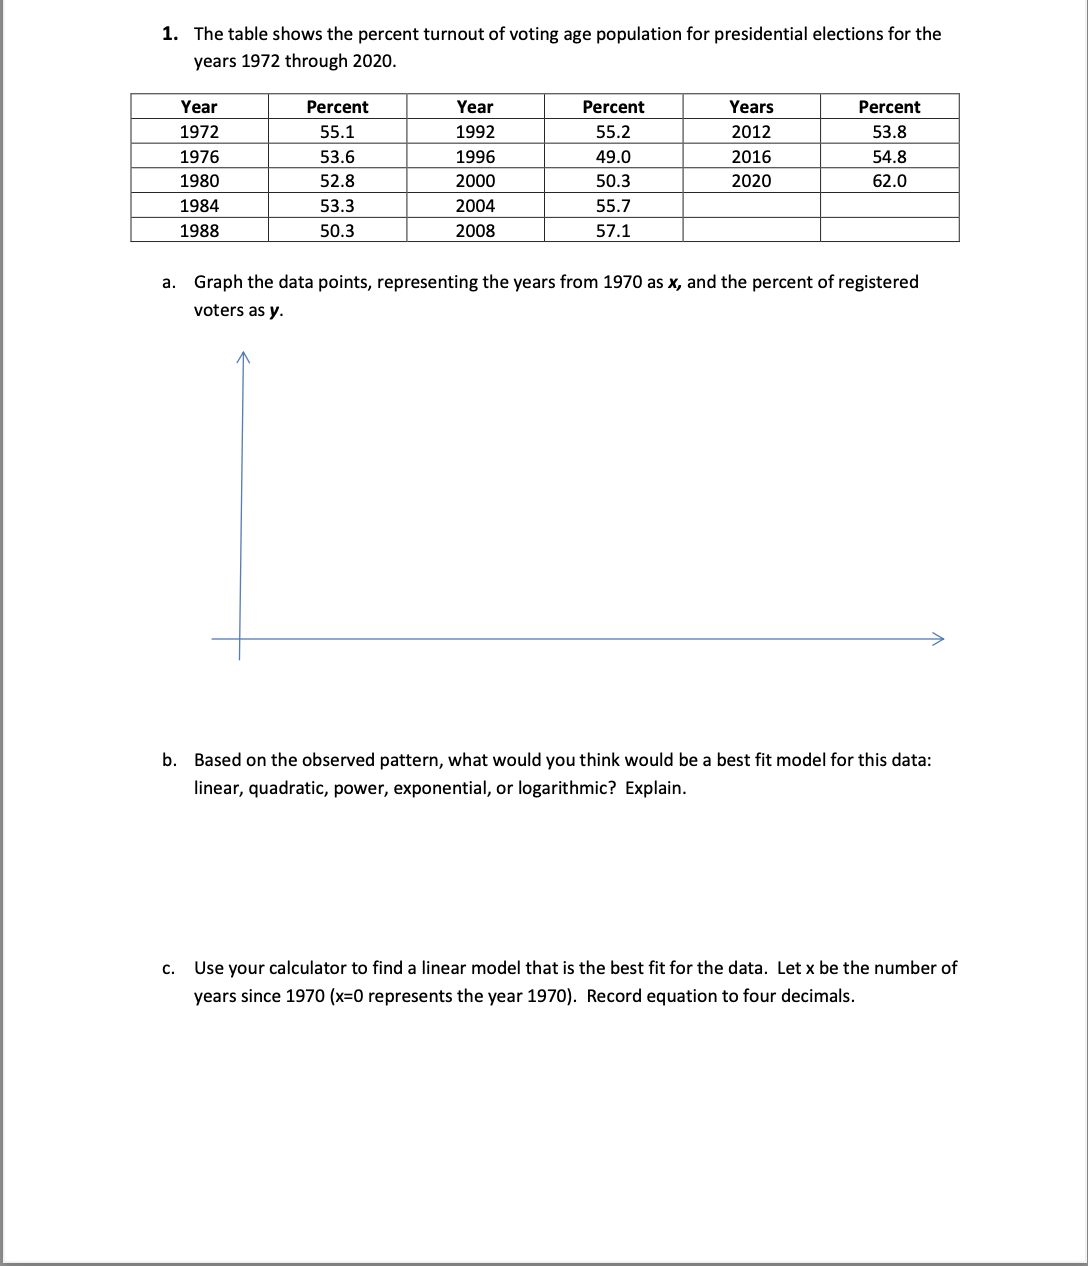
Question: 1. The table shows the percent turnout of voting age population for presidential elections for the years 1972 through 2020. Years Percent 2012 53.8 1976

1. The table shows the percent turnout of voting1. The table shows the percent turnout of voting1. The table shows the percent turnout of voting
1. The table shows the percent turnout of voting age population for presidential elections for the years 1972 through 2020. Years Percent 2012 53.8 1976 53.6 1996 49.0 2016 54.8 1980 52.8 2000 50.3 2020 62.0 1984 53.3 2004 55.7 1988 50.3 2008 57.1 a. Graph the data points, representing the years from 1970 as x, and the percent of registered voters as y. A % b. Based on the observed pattern, what would you think would be a best t model for this data: linear, quadratic, power, exponential, or logarithmic? Explain. c. Use your ca lculatorto find a linear model that is the best t for the data. Let x be the number of years since 1970 (x=0 represents the year 1970}. Record equation to four decimals. d. Use your calculator to nd a quadratic model that is the best t for the data. Let x be the number of years since 1970. Record equation to four decimals. e. Use your calculator to find an exponential model that is the best fit for the data. Let x be the number of years since 1970. Record equation to four decimals. f. Use your calculator to find a power model that is the best t for the data. Let x be the number of years since 1970. Record equation to four decimals. g. Use each ofthe models to calculate the predicted percentage for 2022. Round your answer to two decimals. 2022 Prediction Quadratic Exponential Power h. Which model would you choose for predicting the percentage of registered voters who would vote in the 2022 presidential election? Explain why you would choose this model. 2. The number of international visitors to the United States for each of the years 2005 through 2016 is given in the table. Year 2005 2006 I2007 2008 2009 2010 2011 2012 2013 2014 2015 International 49.2 51 56.1 58 55.1 60 62.8 66.7 70 75 77.5 Vlsltors {In mllllons) b. Label the axes and graph the equation and the data points below. '1' 7) Find a logarithmic function that models this data. Align the input to be the number ofvears after 2000 (x=0 represents the year 2000). Record equation to four decimals. Use the logarithmic model to estimate the number of international visitors to the United States in 2020. Research online to find the number of international visitors to the US in 2020. Record you answer and copy the URL address that helped you find the information. Give some explanation for the difference in your estimate {part c) and the actual number {part d.)

Step by Step Solution

There are 3 Steps involved in it

1 Expert Approved Answer
Step: 1 Unlock blur-text-image
Question Has Been Solved by an Expert!

Get step-by-step solutions from verified subject matter experts

Step: 2 Unlock
Step: 3 Unlock

Students Have Also Explored These Related Mathematics Questions!