Question: 1. The value of d in the sinusoidal function is * 2 points The highest tides on Earth occur in the Minas Basin in the
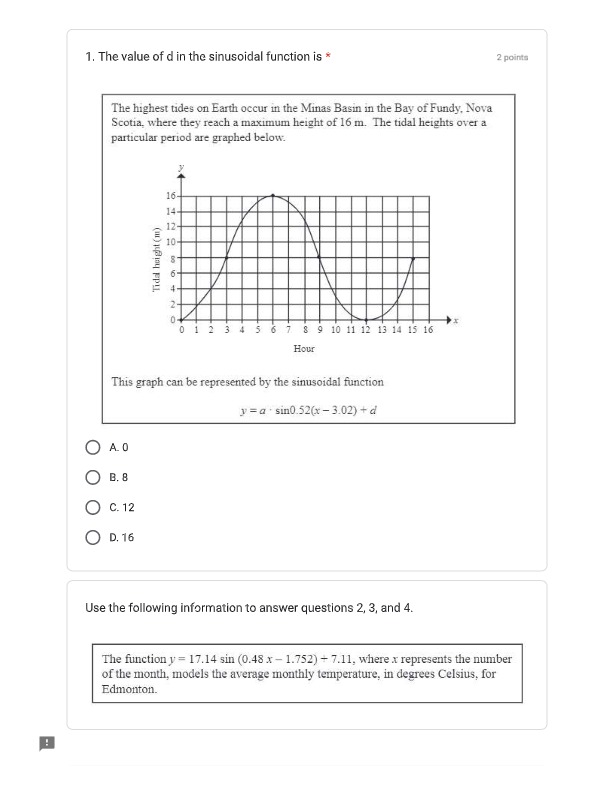
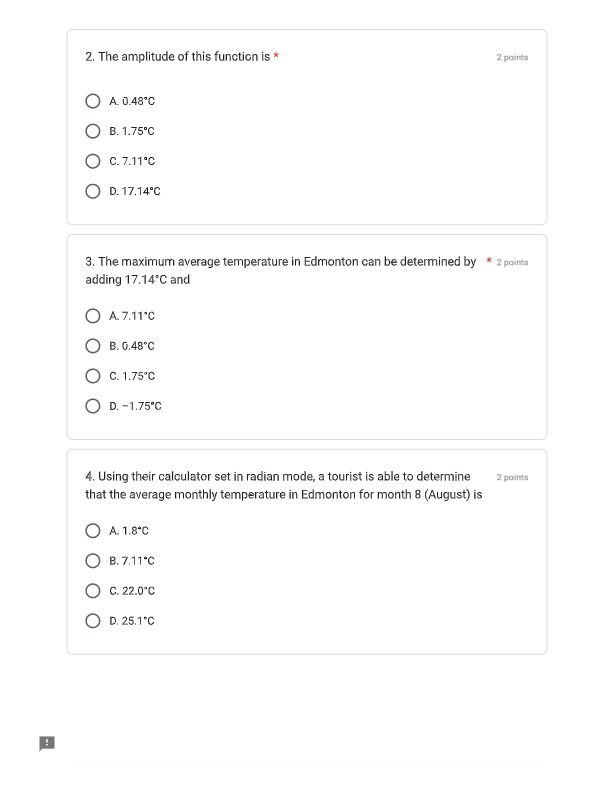
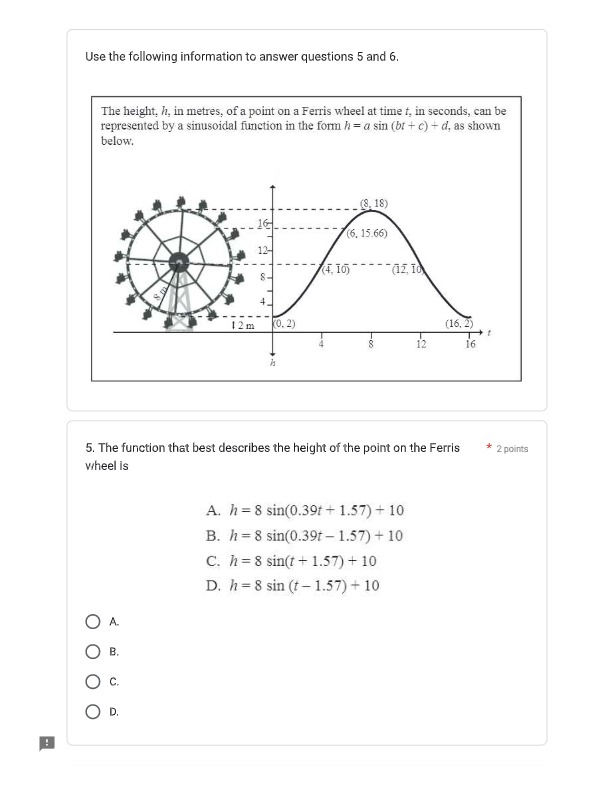
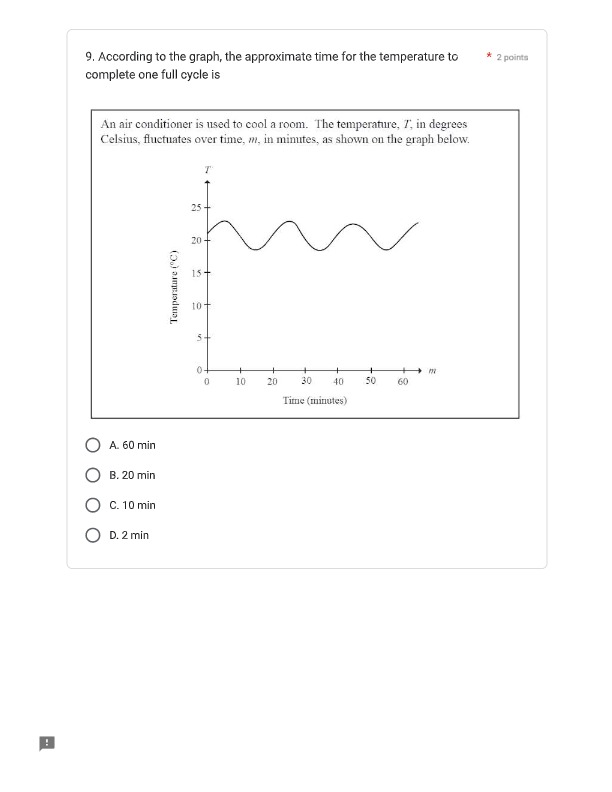
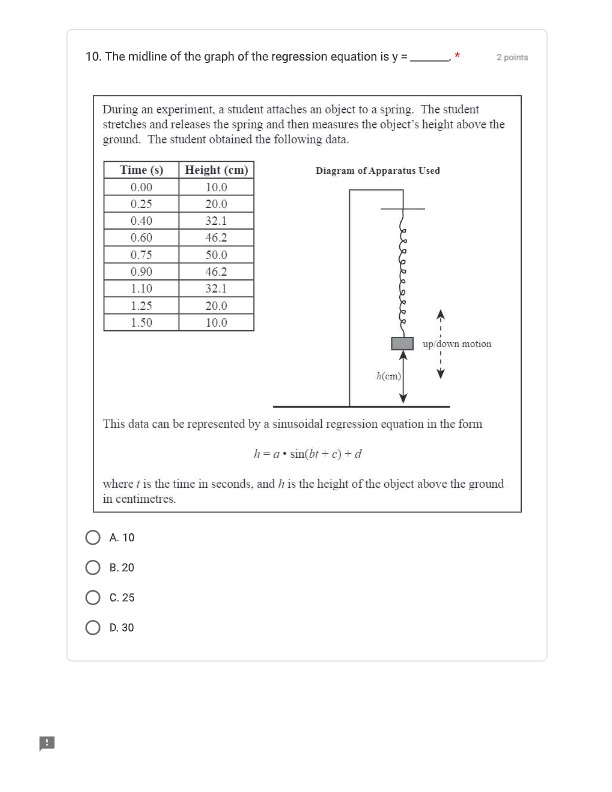
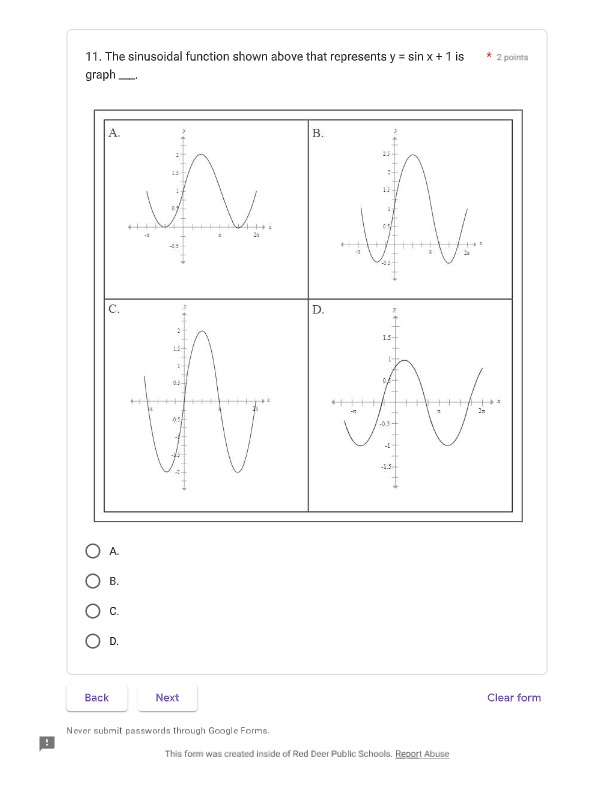
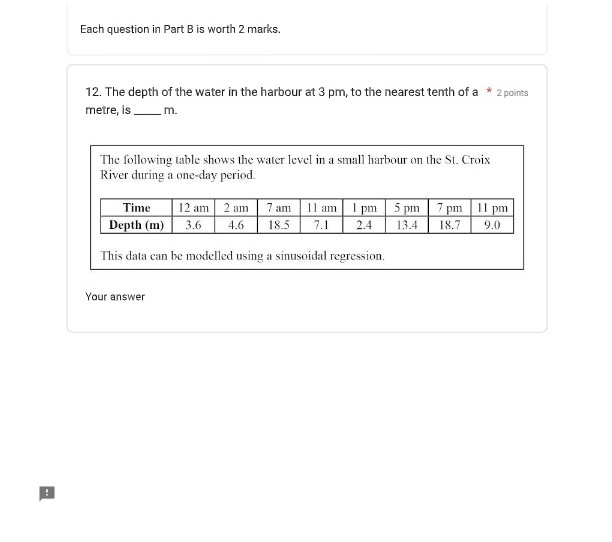
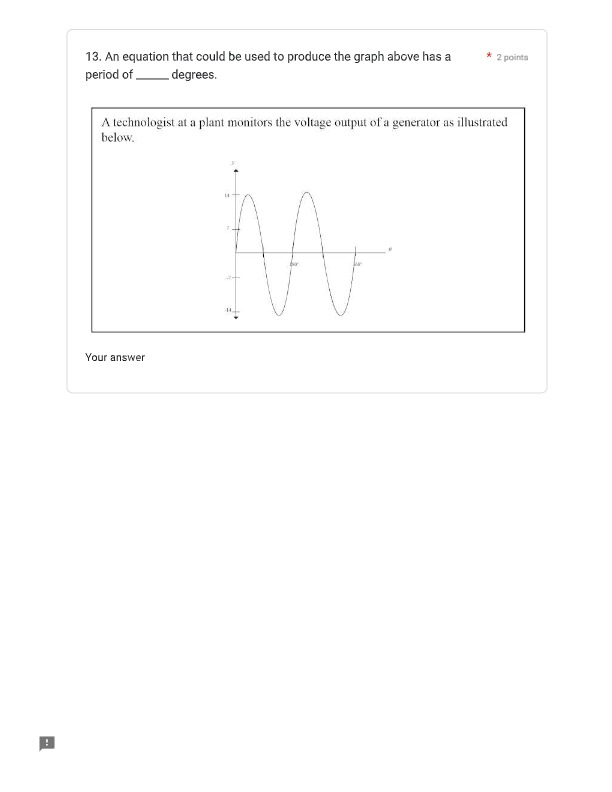
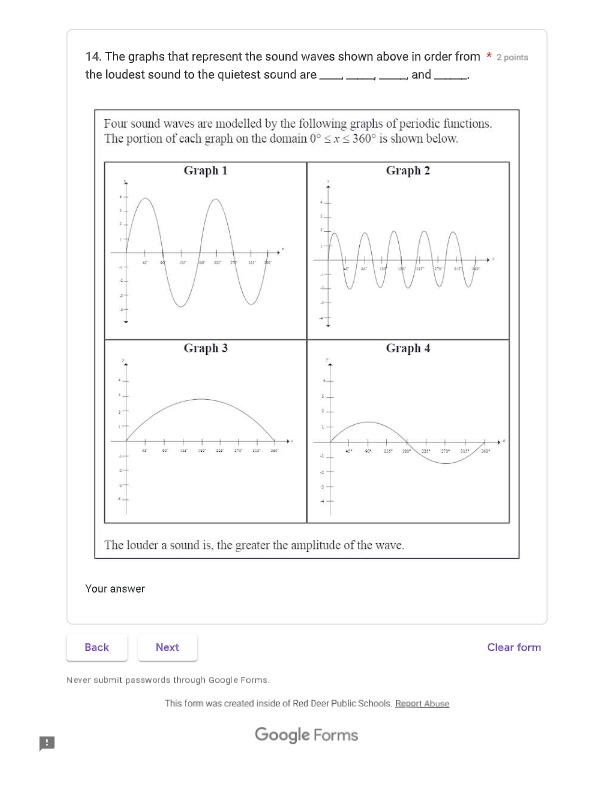
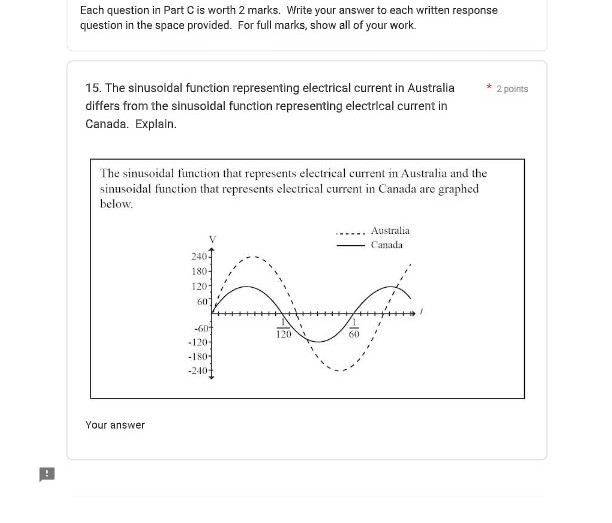
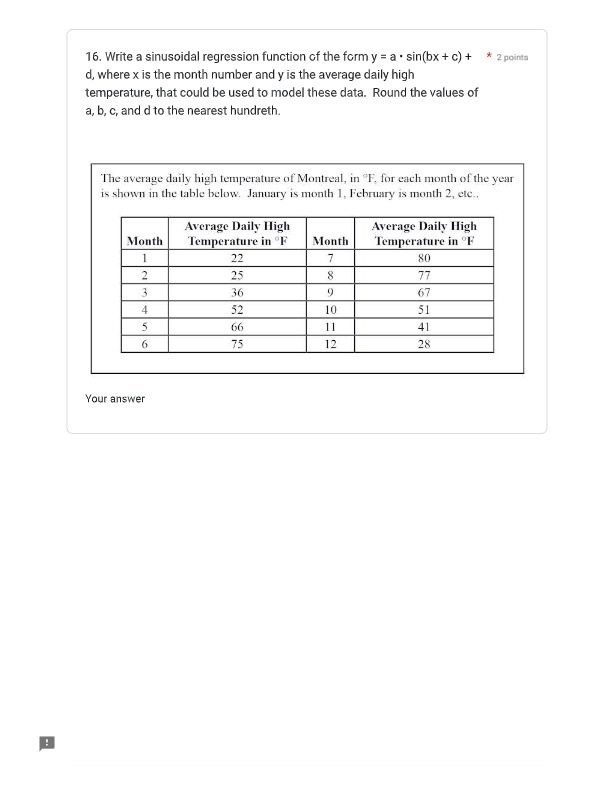
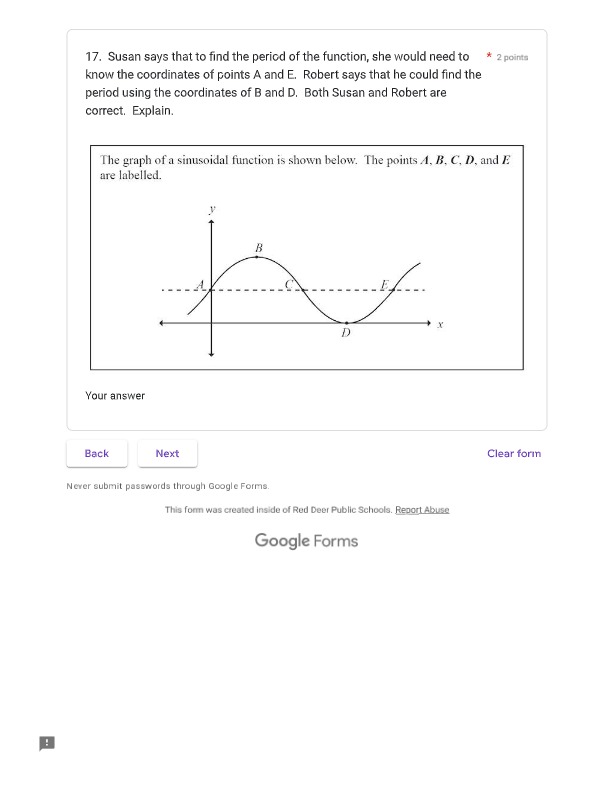
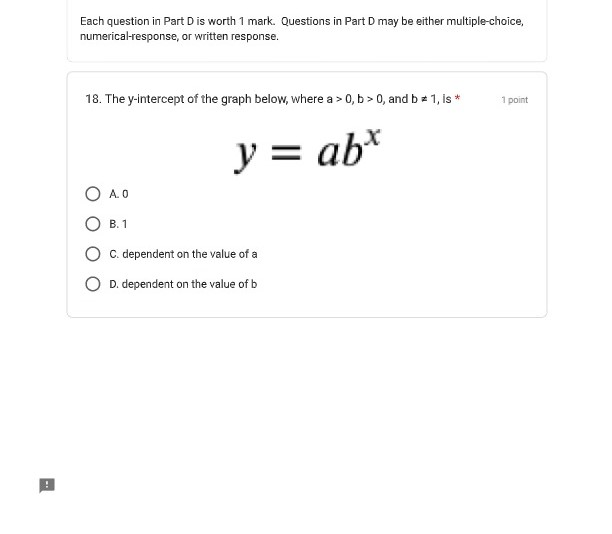
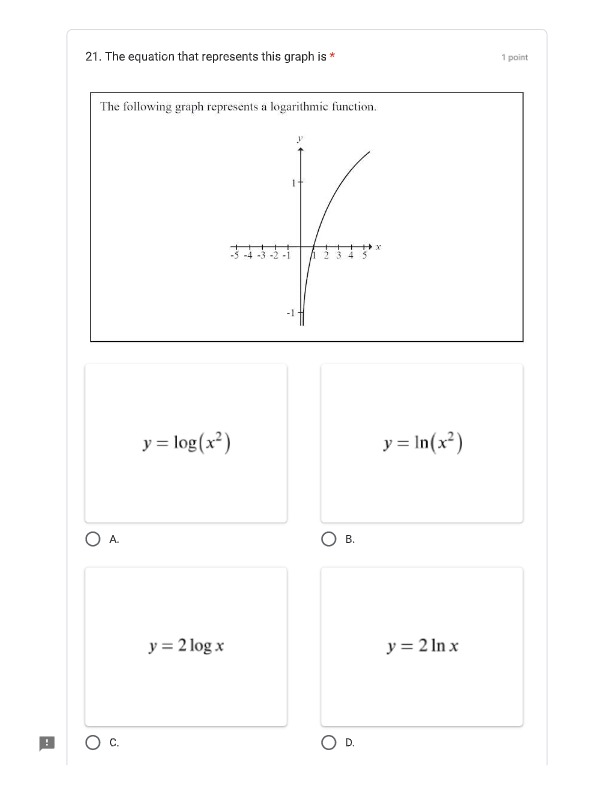
1. The value of d in the sinusoidal function is * 2 points The highest tides on Earth occur in the Minas Basin in the Bay of Fundy, Nova Scotia, where they reach a maximum height of 16 m. The tidal heights over a particular period are graphed below. 16- 14 Tidal height (m) 0 2 3 7 8 9 10 11 12 13 14 15 16 Hour This graph can be represented by the sinusoidal function y = a sin0.52(x - 3.02) + d O AO O B. B C. 12 D. 16 Use the following information to answer questions 2, 3, and 4. The function y = 17.14 sin (0.48 x - 1.752) + 7.11, where x represents the number of the month, models the average monthly temperature, in degrees Celsius, for Edmonton.2. The amplitude of this function is * 2 points A. 0.48"C B. 1.75.C O C. 7.11 .C () D. 17.14.C 3. The maximum average temperature in Edmonton can be determined by * 2 points adding 17.14*C and A 7.11'C B. G.48"C C. 1.75'C O D. -1.75*C 4. Using their calculator set in radian mode, a tourist is able to determine 2 points that the average monthly temperature in Edmonton for month 8 (August) is A. 1.8*C B. 7.11 *C C. 22.0"C O D. 25.1"CUse the following information to answer questions 5 and 6. The height, h, in metres, of a point on a Ferris wheel at time t, in seconds, can be represented by a sinusoidal function in the form h = a sin (br + c) + d, as shown below. (8, 18) 16. (6, 15.66) 12- 8- + 12m (0. 2) (16, 2) 12 16 5. The function that best describes the height of the point on the Ferris * 2 points wheel is A. h =8 sin(0.39t + 1.57) + 10 B. h = 8 sin(0.39t - 1.57) + 10 C. h = 8 sin(t + 1.57) + 10 D. h = 8 sin (t - 1.57) + 10 O A O O C. O D.6. The amplitude of this sinusoidal function is * 2 points A. 10 m B. 8m C. 4.02 m D. 1.57 m Back Next Clear form Never submit passwords through Google Forms. This form was created inside of Red Deer Public Schools. Report Abuse Google Forms7. A student wants to determine when the chair will be at a height of 15 m. * 2 points The student could graph the given sine function and look for The height of a chair on another Ferris wheel follows the equation 1 = 8.7 sin(0.31x) + 10.9 where y is the height (in metres) and x is the time (in seconds). O A. x-intercepts B. y-intercepts O C. points where x = 15 D. points where y = 158. The maximum height of the point on the bottom of the piston is * 2 points The motion of a particular point on the bottom of an engine piston moving up and down in its cylinder can be modelled by the function h = 1.93 sin(216.66x) + 2.45 where / is the distance in inches between the bottom of the piston and the bottom of the cylinder, and x is the time in seconds. A. 4.38 in B. 3.86 in C. 2,45 in O D. 1.93 in9. According to the graph, the approximate time for the temperature to * 2 points complete one full cycle is An air conditioner is used to cool a room. The temperature, 7, in degrees Celsius, fluctuates over time, m, in minutes, as shown on the graph below. 25 20 - 15 + Temperature ("C) 10 20 30 40 50 60 Time (minutes) O A. 60 min B. 20 min C. 10 min D. 2 min10. The midline of the graph of the regression equation is y = 2 points During an experiment, a student attaches an object to a spring. The student stretches and releases the spring and then measures the object's height above the ground. The student obtained the following data. Time (s) Height (cm) Diagram of Apparatus Used 0.00 10.0 0.25 20.0 0.40 32.1 0.60 46.2 0.75 50.0 0.90 16.2 1.10 32.1 1.25 20.0 1.50 10.0 up down motion h(om) This data can be represented by a sinusoidal regression equation in the form h = a * sin(bf + c) + d where / is the time in seconds, and / is the height of the object above the ground in centimetres. A. 10 B. 20 O C. 25 O D. 3011. The sinusoidal function shown above that represents y = sin x + 1 is * 2 points graph _ A. B. C. D. A -1.5 O O B. O c. O D. Back Next Clear form Never submit passwords through Google Forms. This form was created inside of Red Deer Public Schools. Report AbuseEach question in Part B is worth 2 marks. 12. The depth of the water in the harbour at 3 pm, to the nearest tenth of a * 2 points metre, Is m. The following table shows the water level in a small harbour on the St. Croix River during a one-day period. Time 12 am 2 am 7 am 11 am I pm 5 pm 7 pm 11 pm Depth (m) 3.6 4.6 18.5 7.1 2.4 13.4 18.7 9.0 This data can be modelled using a sinusoidal regression. Your answer13. An equation that could be used to produce the graph above has a * 2 points period of . _degrees. A technologist at a plant monitors the voltage output of a generator as illustrated below. Your answer14. The graphs that represent the sound waves shown above in order from * 2 points the loudest sound to the quietest sound are and Four sound waves are modelled by the following graphs of periodic functions. The portion of each graph on the domain 0 s x s 360 is shown below. Graph 1 Graph 2 AAAA Graph 3 Graph 4 The louder a sound is, the greater the amplitude of the wave. Your answer Back Next Clear form Never submit passwords through Google Forms. This form was created inside of Red Deer Public Schools. Report Abuse Google FormsEach question in Part C is worth 2 marks. Write your answer to each written response question in the space provided. For full marks, show all of your work. 15. The sinusoidal function representing electrical current in Australia * 2 points differs from the sinusoidal function representing electrical current in Canada. Explain. The sinusoidal function that represents electrical current in Australia and the sinusoidal function that represents electrical current in Canada are graphed below. V memo Australia Canada 2401 180- 120- 607 -GD 120 - 120- -180- -240 Your answer16. Write a sinusoidal regression function of the formy = a . sin(bx + c) + * 2 points d, where x is the month number and y is the average daily high temperature, that could be used to model these data. Round the values of a, b, c, and d to the nearest hundreth. The average daily high temperature of Montreal, in "F. for each month of the year is shown in the table below. January is month 1, February is month 2, etc.. Average Daily High Average Daily High Month Temperature in "F Month Temperature in "F 1 27 7 80 2 25 8 77 36 9 67 52 10 51 66 11 41 6 75 12 28 Your answer17. Susan says that to find the period of the function, she would need to * 2 points know the coordinates of points A and E. Robert says that he could find the period using the coordinates of B and D. Both Susan and Robert are correct. Explain. The graph of a sinusoidal function is shown below. The points . B. C. D. and E are labelled. B D Your answer Back Next Clear form Never submit passwords through Google Forms. This form was created inside of Red Deer Public Schools. Report Abuse Google FormsEach question in Part D is worth 1 mark. Questions in Part D may be either multiple-choice, numerical-response, or written response. 18. The y-intercept of the graph below, where a > 0, b > 0, and b # 1, is * 1 point y = abx O AO O B. 1 O C. dependent on the value of a O D. dependent on the value of b19. A single 6-sided die is rolled. What is the probability of rolling a number * 1 point that is not a 3? al - aIN O A O B alu O c. O D. 20. Simplify the rational expression below and write it in the form of 1/b. * 1 point The value of b is x2 - 4 2x - 4 Your answer21. The equation that represents this graph is * 1 point The following graph represents a logarithmic function. y = log (x2) y = In(x2) O A O B. y = 2 log x y = 2In x O c. O D.22. Using the equation below, find the value of x, to the nearest hundredth is * 1 point log, 3 = x Your answer 23. The fifth row of the pattern will be * 1 point Three rows of a pattern are shown below. Row 1 1 x8+1=9 Row 2 12 x 8 + 2 =98 Row 3 123 x 8+3-987 A. 1 234 x 8 +4 = 9 876 O B. 1 234 * 8 + 5 = 9 876 O C. 12 345 x 8 + 4 = 98 765 D. 12 345 x 8 + 5 = 98 765 Back Submit Clear form Never submit passwords through Google Forms. This form was created inside of Red Deer Public Schools. Report Abuse Google Forms
Step by Step Solution
There are 3 Steps involved in it
1 Expert Approved Answer
Step: 1 Unlock
Question Has Been Solved by an Expert!
Get step-by-step solutions from verified subject matter experts
Step: 2 Unlock
Step: 3 Unlock
Students Have Also Explored These Related Mathematics Questions!