

1. The variable AudienceScore in the Hollywood Movies dataset gives an audience rating of all major...
Fantastic news! We've Found the answer you've been seeking!
Question:
Transcribed Image Text:
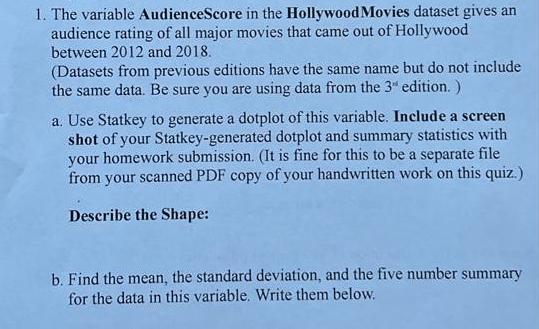
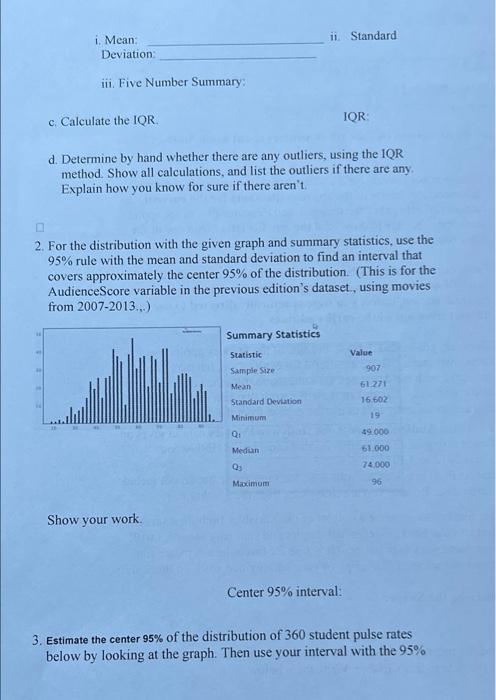
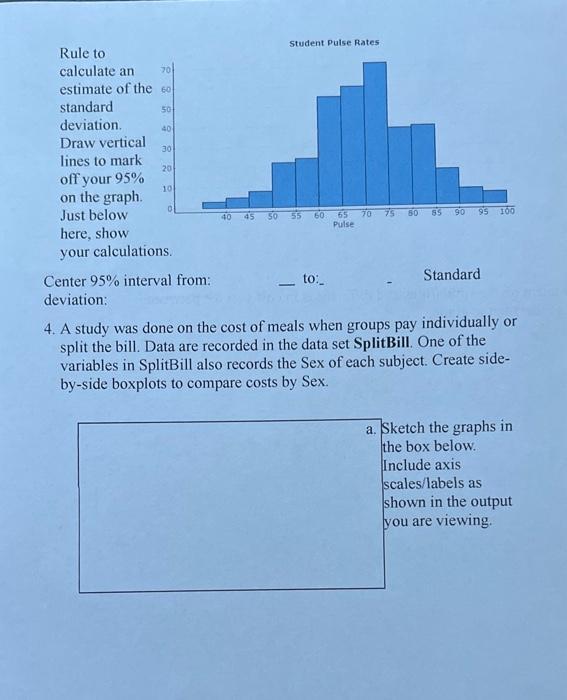
1. The variable AudienceScore in the Hollywood Movies dataset gives an audience rating of all major movies that came out of Hollywood between 2012 and 2018. (Datasets from previous editions have the same name but do not include the same data. Be sure you are using data from the 3" edition. ) a. Use Statkey to generate a dotplot of this variable. Include a screen shot of your Statkey-generated dotplot and summary statistics with your homework submission. (It is fine for this to be a separate file from your scanned PDF copy of your handwritten work on this quiz.) Describe the Shape: b. Find the mean, the standard deviation, and the five number summary for the data in this variable. Write them below. i. Mean: Deviation: iii. Five Number Summary: c. Calculate the IQR. d. Determine by hand whether there are any outliers, using the IQR method. Show all calculations, and list the outliers if there are any. Explain how you know for sure if there aren't. Show your work. ii. Standard 2. For the distribution with the given graph and summary statistics, use the 95% rule with the mean and standard deviation to find an interval that covers approximately the center 95% of the distribution. (This is for the AudienceScore variable in the previous edition's dataset, using movies from 2007-2013...) Summary Statistics Statistic Sample Size Mean Standard Deviation Minimum Q₁ Median Q₁ Maximum IQR: Center 95% interval: Value 907 61.271 16.602 19 49.000 61.000 74,000 96 3. Estimate the center 95% of the distribution of 360 student pulse rates below by looking at the graph. Then use your interval with the 95% Rule to calculate an 70 estimate of the 60 standard deviation. 50 40 Draw vertical lines to mark off your 95% on the graph. Just below here, show your calculations. 30 20 10 0 Center 95% interval from: deviation: Student Pulse Rates. 40 45 50 55 60 65 70 75 80 85 90 95 100 Pulse _to:_ Standard 4. A study was done on the cost of meals when groups pay individually or split the bill. Data are recorded in the data set SplitBill. One of the variables in SplitBill also records the Sex of each subject. Create side- by-side boxplots to compare costs by Sex. a. Sketch the graphs in the box below. Include axis scales/labels as shown in the output you are viewing. b. Comment on the similarities and differences in cost you see between the genders in the graph. 1. The variable AudienceScore in the Hollywood Movies dataset gives an audience rating of all major movies that came out of Hollywood between 2012 and 2018. (Datasets from previous editions have the same name but do not include the same data. Be sure you are using data from the 3" edition. ) a. Use Statkey to generate a dotplot of this variable. Include a screen shot of your Statkey-generated dotplot and summary statistics with your homework submission. (It is fine for this to be a separate file from your scanned PDF copy of your handwritten work on this quiz.) Describe the Shape: b. Find the mean, the standard deviation, and the five number summary for the data in this variable. Write them below. i. Mean: Deviation: iii. Five Number Summary: c. Calculate the IQR. d. Determine by hand whether there are any outliers, using the IQR method. Show all calculations, and list the outliers if there are any. Explain how you know for sure if there aren't. Show your work. ii. Standard 2. For the distribution with the given graph and summary statistics, use the 95% rule with the mean and standard deviation to find an interval that covers approximately the center 95% of the distribution. (This is for the AudienceScore variable in the previous edition's dataset, using movies from 2007-2013...) Summary Statistics Statistic Sample Size Mean Standard Deviation Minimum Q₁ Median Q₁ Maximum IQR: Center 95% interval: Value 907 61.271 16.602 19 49.000 61.000 74,000 96 3. Estimate the center 95% of the distribution of 360 student pulse rates below by looking at the graph. Then use your interval with the 95% Rule to calculate an 70 estimate of the 60 standard deviation. 50 40 Draw vertical lines to mark off your 95% on the graph. Just below here, show your calculations. 30 20 10 0 Center 95% interval from: deviation: Student Pulse Rates. 40 45 50 55 60 65 70 75 80 85 90 95 100 Pulse _to:_ Standard 4. A study was done on the cost of meals when groups pay individually or split the bill. Data are recorded in the data set SplitBill. One of the variables in SplitBill also records the Sex of each subject. Create side- by-side boxplots to compare costs by Sex. a. Sketch the graphs in the box below. Include axis scales/labels as shown in the output you are viewing. b. Comment on the similarities and differences in cost you see between the genders in the graph.
Expert Answer:

Related Book For 

Statistics Unlocking the Power of Data
ISBN: 978-1118583104
1st edition
Authors: Robin H. Lock, Patti Frazer Lock, Kari Lock Morgan, Eric F. Lock, Dennis F. Lock
Posted Date:
Students also viewed these accounting questions
-
Find the mean and standard deviation of the variable x, given the mean and standard deviation of the population and the sample size.
-
Find the mean and standard deviation for each binomial random variable: a. n = 8, = .10 b. n = 10, = .40 c. n = 12, = .50
-
Find the mean and standard deviation for each binomial random variable: a. n = 30, = .90 b. n = 80, = .70 c. n = 20, = .80
-
Suppose that Serendipity Bank has excess reserves of $8000 and checkable deposits of $150,000. If the reserve ratio is 20 percent, what is the size of the banks actual reserves?
-
Why does traditional NPV analysis tend to underestimate the true value of a capital budgeting project?
-
Differentiate between kinetic energy and potential energy.
-
Determine the maximum force \(P\) that can be applied to the handle so that the A-36 steel control rod \(B C\) does not buckle. The rod has a diameter of \(25 \mathrm{~mm}\). 350 mm A 250 mm B 45 800...
-
Presented below is information related to equipment owned by Pujols Company at December 31, 2012. Cost (residual value $0) .........$9,000,000 Accumulated depreciation to date ....1,000,000...
-
You have recently been hired by Clear Company, which produces windows for personal homes. Based on the following information, prepare a flexible budget for 3,500; 4,000; and 4,500 units: Direct...
-
Company A is a global company based in the United States that operates in the financial industry. Company A serves its customers with financial products, such as checking accounts, bank cards, and...
-
Which of the following is FALSE regarding control charts? A)Values above the upper control limits imply that the product's quality is exceeding expectations. B) Control charts are built so that new...
-
Subtract and simplify. 4 1 25 50
-
Finding Domain write answers in interval notation 3. f(x) = x-14x - 6x-1 2
-
Multiply and leave your answer in scientific notation. (2 106) (3 105) =
-
At the North Pole, Santa likes to drink his hot chocolate with little marshmallows. The marshmallows melt in the hot chocolate exponentially over time. One 5g marshmallow melts to 3.85 g in 72...
-
Explain why |x| p, for p < 0
-
7. The most common collateral used in repo agreements is: a. mortgage-backed securities b. U.S. Treasury securities c. collateralized loan obligations d. watches
-
Access the Federation of Tax Administrators Internet site at www. taxadmin.org/state-tax-forms and indicate the titles of the following state tax forms and publications: a. Minnesota Form M-100 b....
-
People in a city are asked if they support a new recycling law. (a) What are the cases? (b) What is the variable and is it quantitative or categorical?
-
Difference in proportion who favor a gun control proposal, using p f = 0.82 for 379 out of 460 females and p m = 0.61 for 318 out of 520 for males. (We found a 90% confidence interval for this...
-
A new study provides some evidence that playing action video games strengthens a persons ability to translate sensory information quickly into accurate decisions. Researchers had 23 male volunteers...
-
Determine the magnitude of force \(\mathbf{F}\) that must be applied at the end of the overhang \(C\) so that when the force \(\mathbf{P}\) is applied, displacement at \(C\) is zero. \(E I\) is...
-
The composite simply supported steel shaft is subjected to a force of \(10 \mathrm{kN}\) at its center. Determine its maximum deflection. \(E_{\mathrm{st}}=200 \mathrm{GPa}\). 200 mm A 200 mm 200 mm...
-
Determine the slope at \(A\) and the maximum deflection. \(E I\) is constant. 20 kip.ft 6 ft A 12 ft- B 6 ft 20 kip-ft

Study smarter with the SolutionInn App