

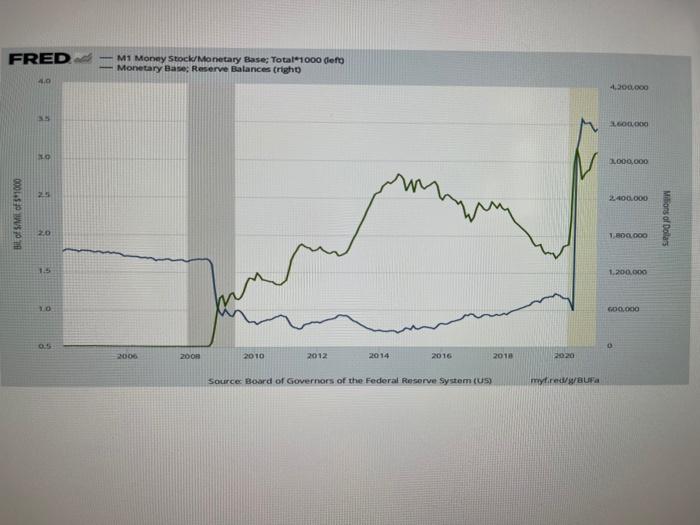
Question: 1). This Graph plots a data series (blue line), M1 money stock divided by the monetsry base and Bank Reserve Balances (green line), from 2004
FRED M1 Money Stock Monetary Base: Total 1000 de Monetary Base Reserve Balances (right) 4.0 4.300.000 35 1.600.000 TO 2.000.000 2015 2.400.000 Bil of Milf 51000 Millions of Dollars 2.0 1.800.000 1.200.000 10 600.000 05 2006 2008 2010 2012 2014 2016 2018 2020 Source Board of Governors of the Federal Reserve System (US) TTYT M / La FRED M1 Money Stock Monetary Base: Total 1000 de Monetary Base Reserve Balances (right) 4.0 4.300.000 35 1.600.000 TO 2.000.000 2015 2.400.000 Bil of Milf 51000 Millions of Dollars 2.0 1.800.000 1.200.000 10 600.000 05 2006 2008 2010 2012 2014 2016 2018 2020 Source Board of Governors of the Federal Reserve System (US) TTYT M / La
Step by Step Solution
There are 3 Steps involved in it

Get step-by-step solutions from verified subject matter experts