

Question: 1. This question will get you to utilize CS-JFB-LC07 Examples.xlsx to examine two dif- ferent option for a firm. Regardless of the option selected, the
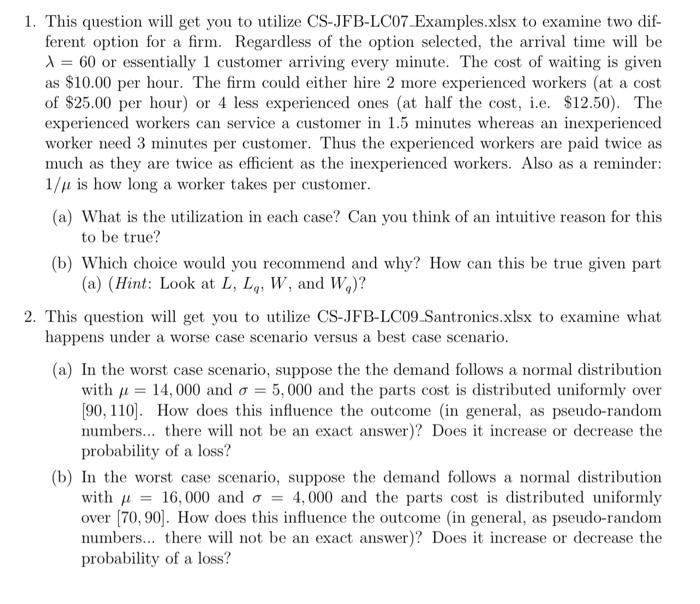
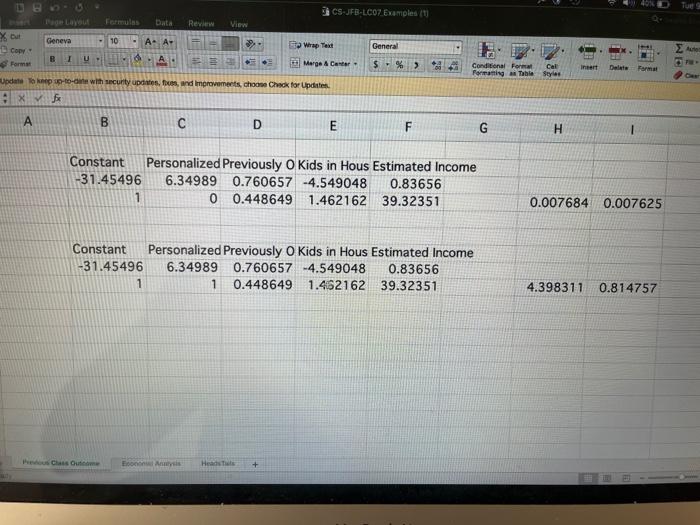
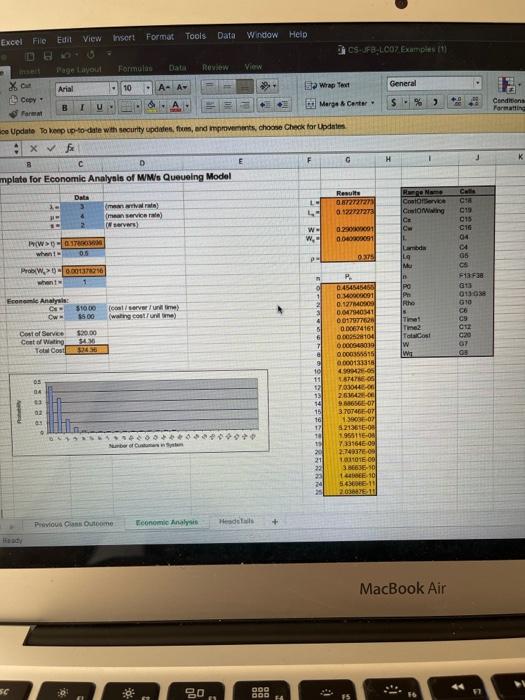
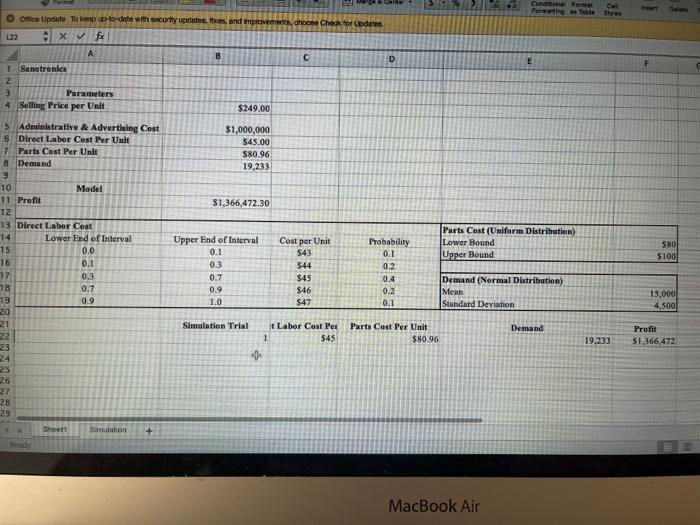
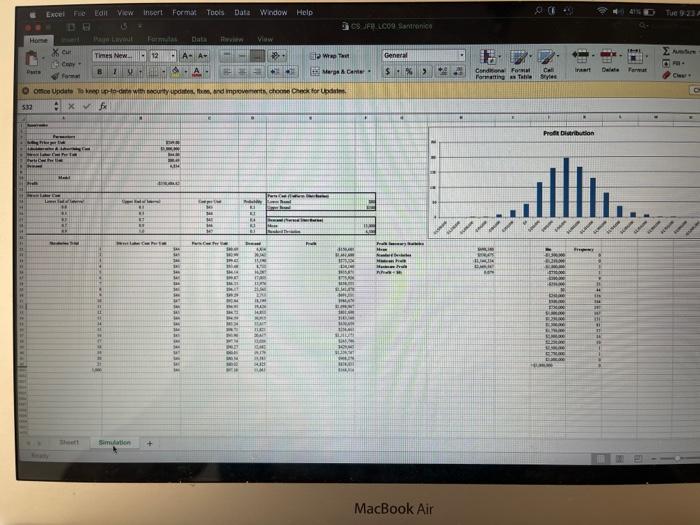
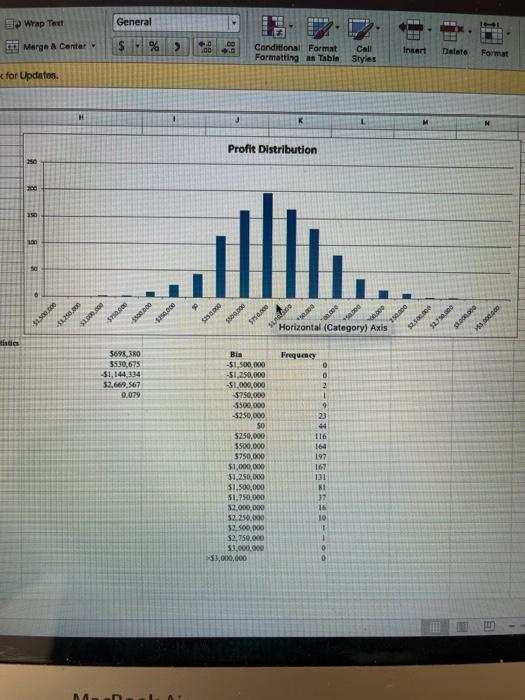
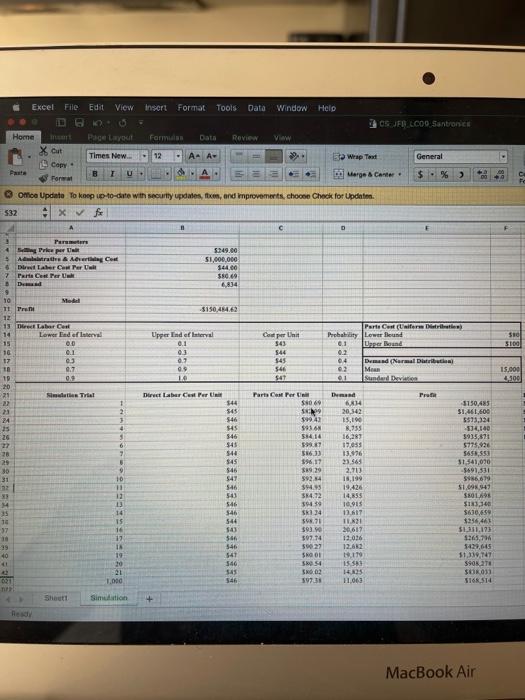
1. This question will get you to utilize CS-JFB-LC07 Examples.xlsx to examine two dif- ferent option for a firm. Regardless of the option selected, the arrival time will be 1 = 60 or essentially 1 customer arriving every minute. The cost of waiting is given as $10.00 per hour. The firm could either hire 2 more experienced workers (at a cost of $25.00 per hour) or 4 less experienced ones (at half the cost, i.e. $12.50). The experienced workers can service a customer in 1.5 minutes whereas an inexperienced worker need 3 minutes per customer. Thus the experienced workers are paid twice as much as they are twice as efficient as the inexperienced workers. Also as a reminder: 1/p is how long a worker takes per customer. (a) What is the utilization in each case? Can you think of an intuitive reason for this to be true? (b) Which choice would you recommend and why? How can this be true given part (a) (Hint: Look at L, Lg, W, and W.)? 2. This question will get you to utilize CS-JFB-LC09 Santronics.xlsx to examine what happens under a worse case scenario versus a best case scenario. (a) In the worst case scenario, suppose the the demand follows a normal distribution with u = 14,000 and o = 5,000 and the parts cost is distributed uniformly over [90, 110). How does this influence the outcome in general, as pseudo-random numbers... there will not be an exact answer)? Does it increase or decrease the probability of a loss? (b) In the worst case scenario, suppose the demand follows a normal distribution with y = 16,000 and o = 4,000 and the parts cost is distributed uniformly over (70,90). How does this influence the outcome (in general, as pseudo-random numbers... there will not be an exact answer)? Does it increase or decrease the probability of a loss? CS-JFB-LCO7 Examples (1) Formulas Data Review View General At WO $ % 2 Geneva 10 - AA- Bo Wrap Text BI WA Format Marge A Center Update topp-to-date with security updates, fous, and improvements, choon Check for Updates f Conditional Format Formaning Table Cal Style Insert B D E F G Constant Personalized Previously o Kids in Hous Estimated Income -31.45496 6.34989 0.760657 -4.549048 0.83656 1 0 0.448649 1.462162 39.32351 0.007684 0.007625 Constant Personalized Previously o Kids in Hous Estimated Income -31.45496 6.34989 0.760657 -4.549048 0.83656 1 1 0.448649 1.462162 39.32351 4.398311 0.814757 E Am Heads In sort Format Tools Data Edit View Excel File Window Help CSUFB-LCOZ Examples Page Layout Formulas Na Review View Arial General 15 Wrap Ten Copy 0 S. % ) Marge Center B Cordians Formatting Hoe Update To keep up-to-date with security updates, from, and improvements, choone Check for Updates :x fe 8 D E F mplate for Economic Analynis of MM/s Queueing Model H Data 1- (www) fan service rate) servers Results 08/272727 0.12.2727273 Pepe Coolervice Celowing 2 Ce WHO W. 0.29 01 0001 018 015 015 C16 04 C4 05 HW-TOM when 0.5 P OT ProbW> 0.0013710 IM n PO Pr Rhe F13 F38 G13 013-03 Economie Analysis GN 31000 15.00 conserver une (wating costrudne) Cw 06 09 CE Cost of Service Contato Tow Cost $20.00 HM $3456 Tint Time? Total cost w WAT 07 OS P. 0.454MM 0.00091 0.127M80 0.04741 0017977 0.00674161 0.00650100 0.0008039 10.00006515 0.000123316 1999428-001 SPATE 7.000440-00 2.64E- 958656-07 370746-07 1.39036-07 5213610 1950116 05 04 01 15 7316162 2.749375 10101E09 3.866110 IDEE 10 5431 2.0367.1 Prvous ass Outcome + Economic Analysis MacBook Air DOO 80 DODH Condo Fame Cal Omee Update To Keep up to date with securly updates, xes, and improvements, hoe Check for det x x B c D E F 1 Sanotronkes 2 3 Parameters 4 Selling Price per Unit $249.00 $1,000,000 545.00 $80.96 19,233 $1,366,472.30 S Administrative & Advertising Cost 6 Direct Labor Cest Per Unit 7 Parts Cost Per Unit 8 Demand 9 10 Model 11 Prent 12 13 Direct Labor Cost 14 Lower End of Interval 15 0.0 16 0.1 17 0.3 18 0.7 19 0.9 20 21 Probability 0.1 Purts Cost (Uniform Distribution) Lower Bound Upper Bound 580 51001 0.2 Upper End of Interval 0.1 0.3 0.7 0.9 1.0 Cost per Unit S43 S44 $45 $46 547 0.4 0.2 0.1 Demand (Normal Distribution) Mean Standard Deviation 15,000 4,500 Simulation Trial Labor Cost Per $45 Parts Cost Per Unit $80.96 Demand 1 Proti $1,366,472 19.233 23 24 25 26 28 29 Simulation + MacBook Air Excel FO Edil View Ingert Form Tools Data Window Help DO CS JFLCO Sonic Home View X C Times New 12 A A it wa MACAM General $ % 3 B 2 ret Condo For Cat mange stes Oon Update Top-to-withourity updates, and improve come here fordi 532 X Prodi Distribution m. ! w th Pra M W H-14 MODE w 1 E NA TH F TE TE TE 11 11 11 FEFEEEEEEEE . WIR Simulation MacBook Air Wrap Text General Marge & Conte % ) 00 Conditional Format Formatting as Table Insert Call Styles Deleto Format
Step by Step Solution
There are 3 Steps involved in it

Get step-by-step solutions from verified subject matter experts