

Question: 1. This table is just like Table 5.3 on p. 76 of Mitchell /Wray/Watts of labor market flows and discussed in part of my notes
1. This table is just like Table 5.3 on p. 76 of Mitchell /Wray/Watts of labor market flows and discussed in part of my notes for this chapter . Fill in the 9 missing values for flows and make sure they add up to the totals in the bottom row and final column .
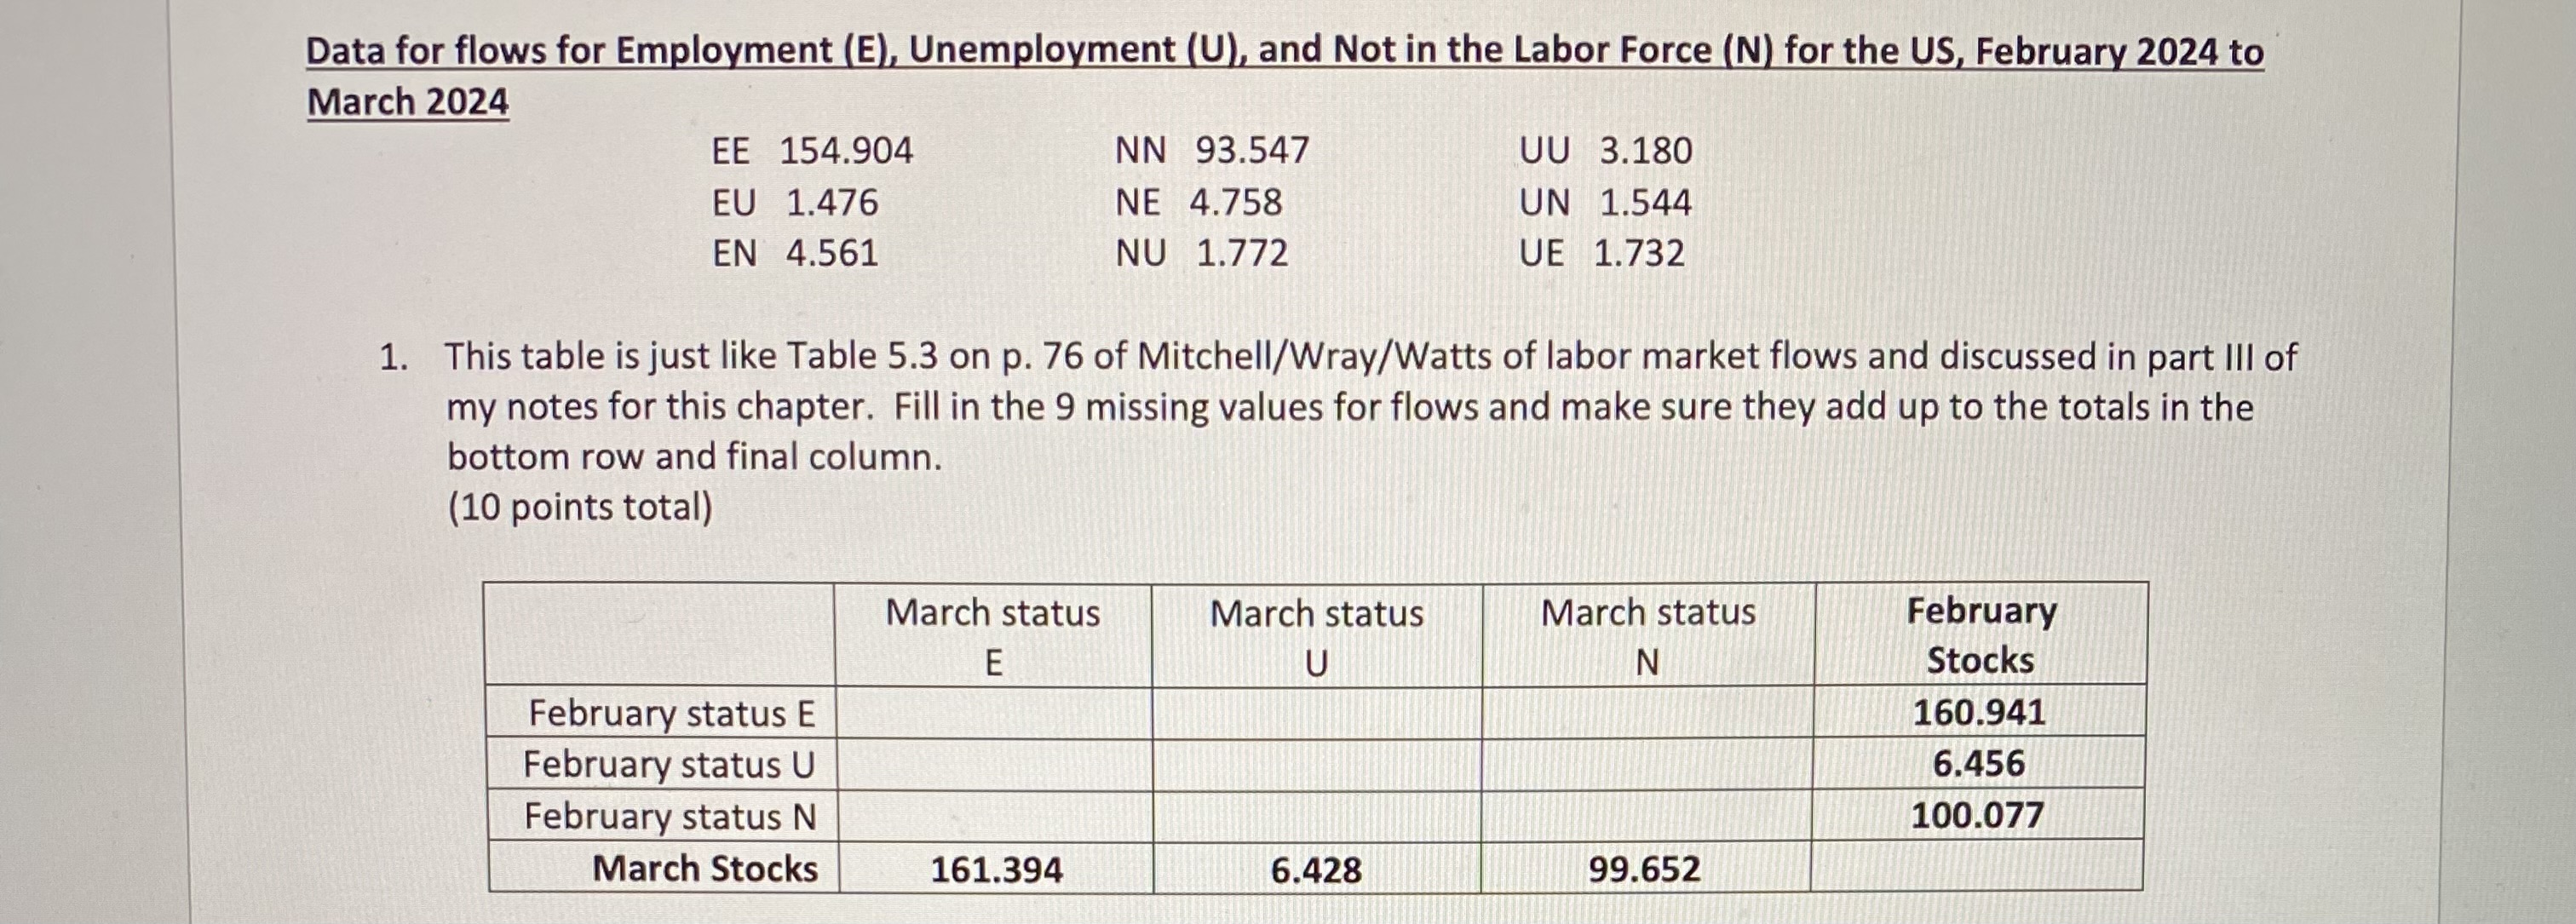
Data for flows for Employment (E), Unemployment (U), and Not in the Labor Force (N) for the US, February 2024 to March 2024 EE 154.904 NN 93.547 UU 3.180 EU 1.476 NE 4.758 UN 1.544 EN 4.561 NU 1.772 UE 1.732 1. This table is just like Table 5.3 on p. 76 of Mitchell/Wray/Watts of labor market flows and discussed in part III of my notes for this chapter. Fill in the 9 missing values for flows and make sure they add up to the totals in the bottom row and final column. (10 points total) March status March status March status February E U N Stocks February status E 160.941 February status U 6.456 February status N 100.077 March Stocks 161.394 6.428 99.652
Step by Step Solution
There are 3 Steps involved in it

Get step-by-step solutions from verified subject matter experts