

Question: 1 to 3 quetsion! please answer General Spectra Data Analysis: 1. Look at your recordiod data for the nitrogen spectrum. Compare what you observed with
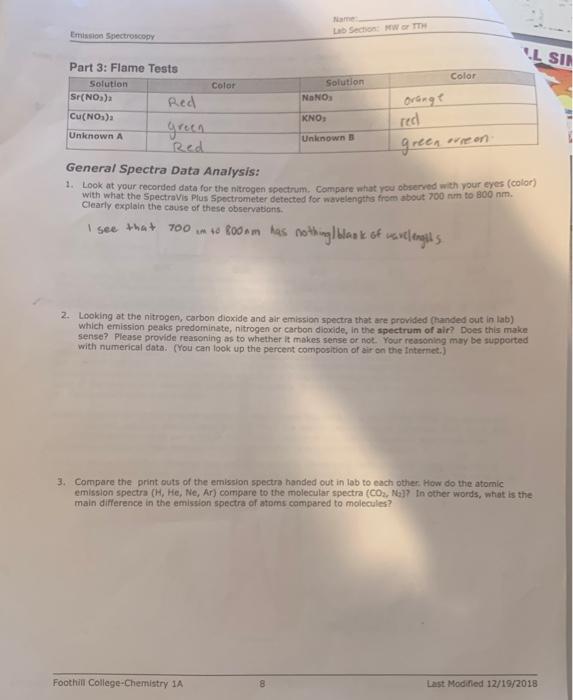
General Spectra Data Analysis: 1. Look at your recordiod data for the nitrogen spectrum. Compare what you observed with your eyes (color) with what the Spectravis Plus Spectrometer detected for wavelengths frem about 700nm to 800nm. Clearly explain the cause of these observabons. 1 see that 700m to 800nm has nothinglbaa k of wavclenglts 2. Looking at the nitrogen, carbon dioxide and air emibsion spectra that are orovided (handed cut in lab) which emission peaks predominate, nitrogen or carbon dioxide, in the spectrum of air? Does this make sense? Please provide reasoning as to whether it makes sense or not. Your reasoning may be supported with numerical dats. (You can look up the percent composition of air on the internet.) 3. Compare the print outs of the emission spectra handed out in lab to each other How do the atomic emission spectra (H, He, Ne, Ar) compare to the molecular spectra (CO2, H2) ? in other words, what is the main difference in the emission spectra of atoms campared to molecules
Step by Step Solution
There are 3 Steps involved in it

Get step-by-step solutions from verified subject matter experts