

Question: 1. Two opposing opinions were shown to a random sample of 2,150 buyers of a particular political news app in the United States. The opinions,
1. Two opposing opinions were shown to a random sample of 2,150 buyers of a particular political news app in the United States. The opinions, shown in a random order to each buyer, were as follows:
Opinion A: The issue of equal pay is more important than increasing the minimum wage.
Opinion B: Increasing the minimum wage is more important than the issue of equal pay.
Buyers were to choose the opinion that most closely reflected their own. If they felt neutral on the topics, they were to choose a third option of "Neutral."
The outcomes were as follows:
50% chose Opinion A, 42% chose Opinion B, and 8% chose "Neutral."
Part A: Make and interpret a 99% confidence interval for the proportion of all US buyers of this particular app who would have chosen Opinion B.
Part B: The number of buyers that chose Opinion B and the number of buyers that did not choose Opinion B are both greater than 10. Why must this inference condition be met?
Part C: Would a two-sample z-interval for a difference between proportions be an appropriate procedure to find if the difference in proportions between US buyers who would have chosen Opinion B and US buyers who would have chosen Opinion A is statistically significant? Explain why or why not.
2. A physician wants to perform a study at a local health center where 250 individuals have stress issues. The purpose of the study would be to determine if doing yoga for 30 minutes helps with improving stress levels compared to sleeping for 30 minutes.
Part A: Describe an appropriate design for the study.
Part B: The hypotheses for this study are as follows:
H0: There is no difference in the mean improvement of stress levels for either treatment.
Ha: The mean improvement of stress levels is greater for the yoga treatment.
The center will allow individuals to do yoga during visits if the null hypothesis is rejected. What are the possible Type I and II errors? Describe the consequences of each in the context of this study and discuss which type you think is more serious.
3. Could the number of courses a college student is enrolled in be related to their employment status? At a local college, a simple random sample of 150 students was selected. Data was collected on each student on how many courses they were currently enrolled in and whether they held a job. The data was then presented in the frequency table:
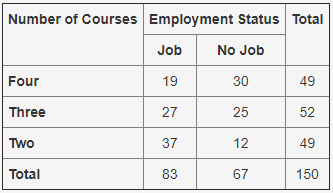
Number of Courses| Employment Status| Total Job No Job Four 19 30 49 Three 27 25 52 TWO 37 12 49 Total 83 67 150
Step by Step Solution
There are 3 Steps involved in it

Get step-by-step solutions from verified subject matter experts