

1. Typically, the majority of Atlantic tropical systems travel westward at lower latitudes and then curve to...
Question:
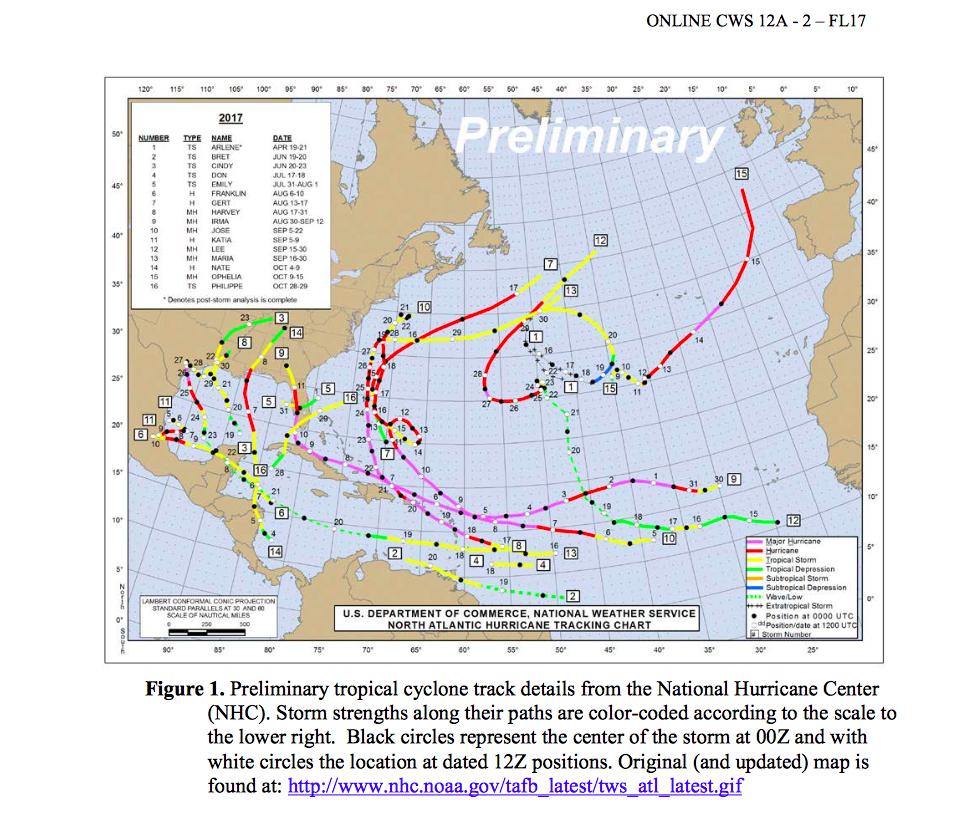
1. Typically, the majority of Atlantic tropical systems travel westward at lower latitudes and then curve to the north and northeast upon reaching the belt of the prevailing westerly winds. With this directional pattern, storms that do not curve until passing about 75° W, ________ likely impact land before turning northward. Storms that form in or travel to the Caribbean Sea or Gulf of Mexico are virtually certain to impact land areas. Hurricane Irma (#9) is one example.
[ ] will
[] willnot
2. One function hurricanes and tropical cyclones perform in the global weather system is to transport heat and moisture from tropical oceans to higher latitudes. For example, look at the path of Hurricane Nate (#14) and Major Hurricane Maria (#13). They originated as tropical systems over warm waters south of 15°N latitude, eventually attaining hurricane strength,
ONLINE CWS 12A - 3 – FL17 later weakening and dissipating beyond 35°N latitude. The storms’ tracks imply that these
cyclones ________ transport energy and moisture to higher latitudes.
[ ] did
[ ] did not
3. The energy for tropical cyclones is primarily delivered to the atmosphere by the water vapor evaporated from warm ocean surfaces. This energy is released within the atmosphere through condensation in thunderstorms and distributed by the persistent, organized wind circulation of the storm. From the color coding of storm intensities indicated on the Figure 1 map of Hurricane Nate (#14), and Hurricane Irma (#9) upon making landfall, the weakening of the storms’ energy would likely have been due to ________.
[ ] reduced evaporation when over land
[ ] increased surface roughness slowing winds
[ ] both of these factors
4. Hurricane Maria (#13) reached peak intensity on 20 September with a Category 5 classification, only one day after raking across Dominca as the first recorded Category 5 storm to ever strike the island. At Category 5, the wind speeds would have been ________ mph. [See Table 2 of Investigation 12A in the Weather Studies Investigations Manual.] For more on Maria, see http://www.weather.gov/sju/maria2017.
[] 74-95
[] 96-110
[] 111-129
[] 130-156
[ ] 157 or greater
5. Because of a Northern Hemisphere hurricane’s counterclockwise circulation around its surface low-pressure center as seen from above, such winds would have brought extensive wind damage, accompanying heavy rainfalls and a damaging storm surge mainly to the ________ of the point where an advancing hurricane’s center would come ashore. In 2012, Hurricane (and then “Superstorm”) Sandy’s circulation center made landfall just south of Atlantic City, NJ, (see Figure 3 of Investigation 12A in the manual) with catastrophic flooding along the shoreline primarily affecting the area to the north, especially near New York City. The results included at least an estimated $50 billion in damages and about 100 deaths in the landfall area.
[ ] left
[ ] right
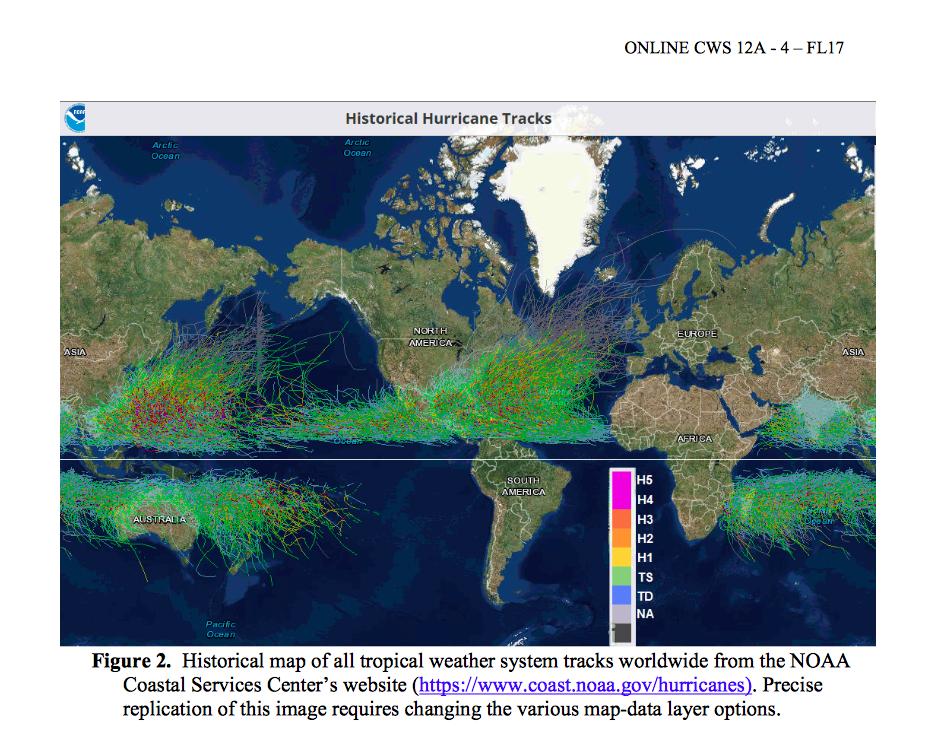
6. Figure 2 is an example NOAA product from an interactive mapping tool (a type of Geographic Information System (GIS)) which can display historic hurricane tracks by ocean basin and color-coded storm strength similar to Figure 1. According to Figure 2, tropical storms forming in either the Northern or Southern Hemispheres ________ cross the equator from one hemisphere to the other. (The equator is shown by the white horizontal line across the image’s mid-section.)
[ ] do
[ ] do not
7. This absence of tropical cyclone activity at the equator (0° latitude) ________ due to the absence of the Coriolis Effect that is essential in producing rotation during storm formation.
[ ] is
[] is not
8. From Figure 2 one can note that many tropical cyclones also occurred in areas including the ________ ocean basin. Super typhoon Haima, a strong Category 5 hurricane and the most destructive storm of 2016 in the Philippine Islands, was among those storms. The frequency of storms in that location is correlated with the large expanses of warm ocean waters year-
round in that part of the ocean. (You may recall the sea surface temperatures plotted in Investigation 9B.)
[ ] western North Pacific
[ ] eastern South Pacific
[ ] South Atlantic
Expert Answer:
will did both of these factors157 or greator right do not is western north pacific 1 Typically the majority of Atlantic tropical systems travel westward at lower latitudes and then curve to the north ... View the full answer


Statistics The Exploration & Analysis Of Data
ISBN: 9780840058010
7th Edition
Authors: Roxy Peck, Jay L. Devore
