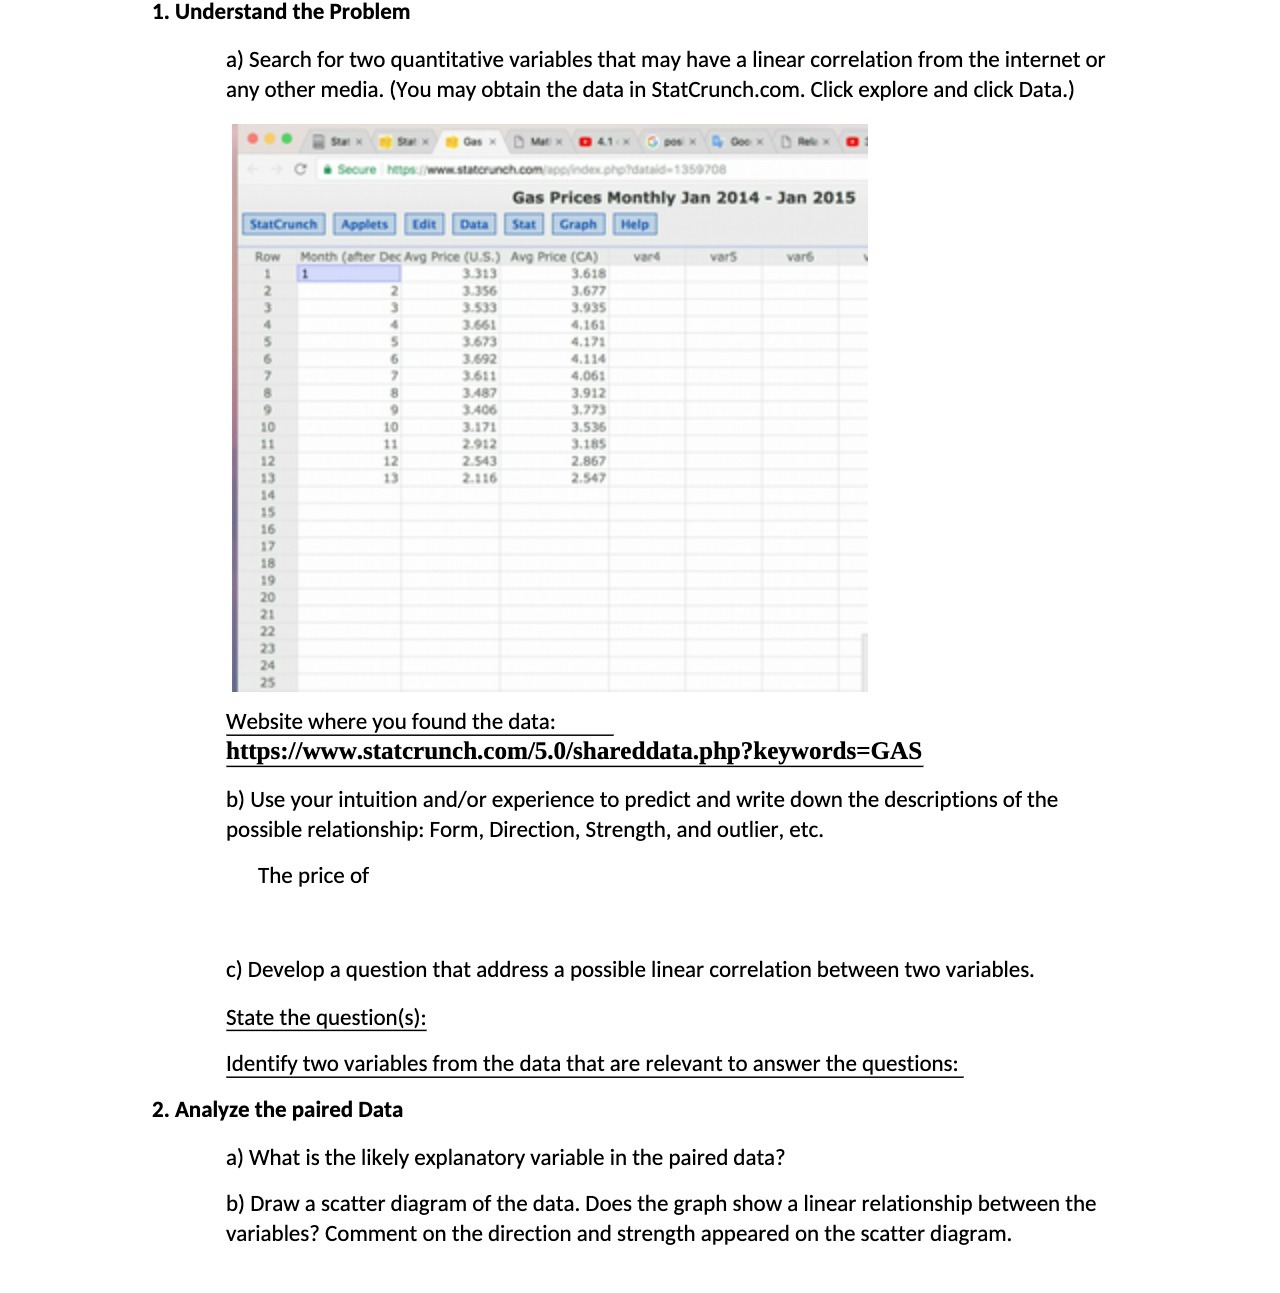
Question: 1. Understand the Problem a) Search for two quantitative variables that may have a linear correlation from the internet or any other media. (You may

1. Understand the Problem a) Search for two
1. Understand the Problem a) Search for two quantitative variables that may have a linear correlation from the internet or any other media. (You may obtain the data in StatCrunch.com. Click explore and click Data.) C & Secure https:/ww d-1359708 Gas Prices Monthly Jan 2014 - Jan 2015 StatCrunch Applets Edit Data Stat Graph Help Row Month (after Dec Avg Price (U.S.) Avg Price (CA) vard wars vare 3.313 .618 3.356 3.677 3.533 3.935 3.661 4.161 3.673 4.171 3.692 4.114 3.611 4.061 3.487 3.912 3.40 3.773 10 3.171 3.536 11 2.912 3.185 12 2.543 2.867 2.116 Website where you found the data: https://www.statcrunch.com/5.0/shareddata.php?keywords=GAS b) Use your intuition and/or experience to predict and write down the descriptions of the possible relationship: Form, Direction, Strength, and outlier, etc. The price of c) Develop a question that address a possible linear correlation between two variables. State the question(s): dentify two variables from the data that are relevant to answer the questions: 2. Analyze the paired Data a) What is the likely explanatory variable in the paired data? b) Draw a scatter diagram of the data. Does the graph show a linear relationship between the variables? Comment on the direction and strength appeared on the scatter diagram

Step by Step Solution

There are 3 Steps involved in it

1 Expert Approved Answer
Step: 1 Unlock blur-text-image
Question Has Been Solved by an Expert!

Get step-by-step solutions from verified subject matter experts

Step: 2 Unlock
Step: 3 Unlock

Students Have Also Explored These Related Mathematics Questions!