

Question: 1. Upload your excel file with a completed R-bar and X-bar chart on a new tab. Make sure to show your intermediate steps (e.g., keep
 1. Upload your excel file with a completed R-bar and X-bar chart on a new tab. Make sure to show your intermediate steps (e.g., keep the calculations visible for your averages).
2. Should the operations team at Dan's Cat Empurrium be concerned with their current process? Why or why not? Support your claims by using the charts.
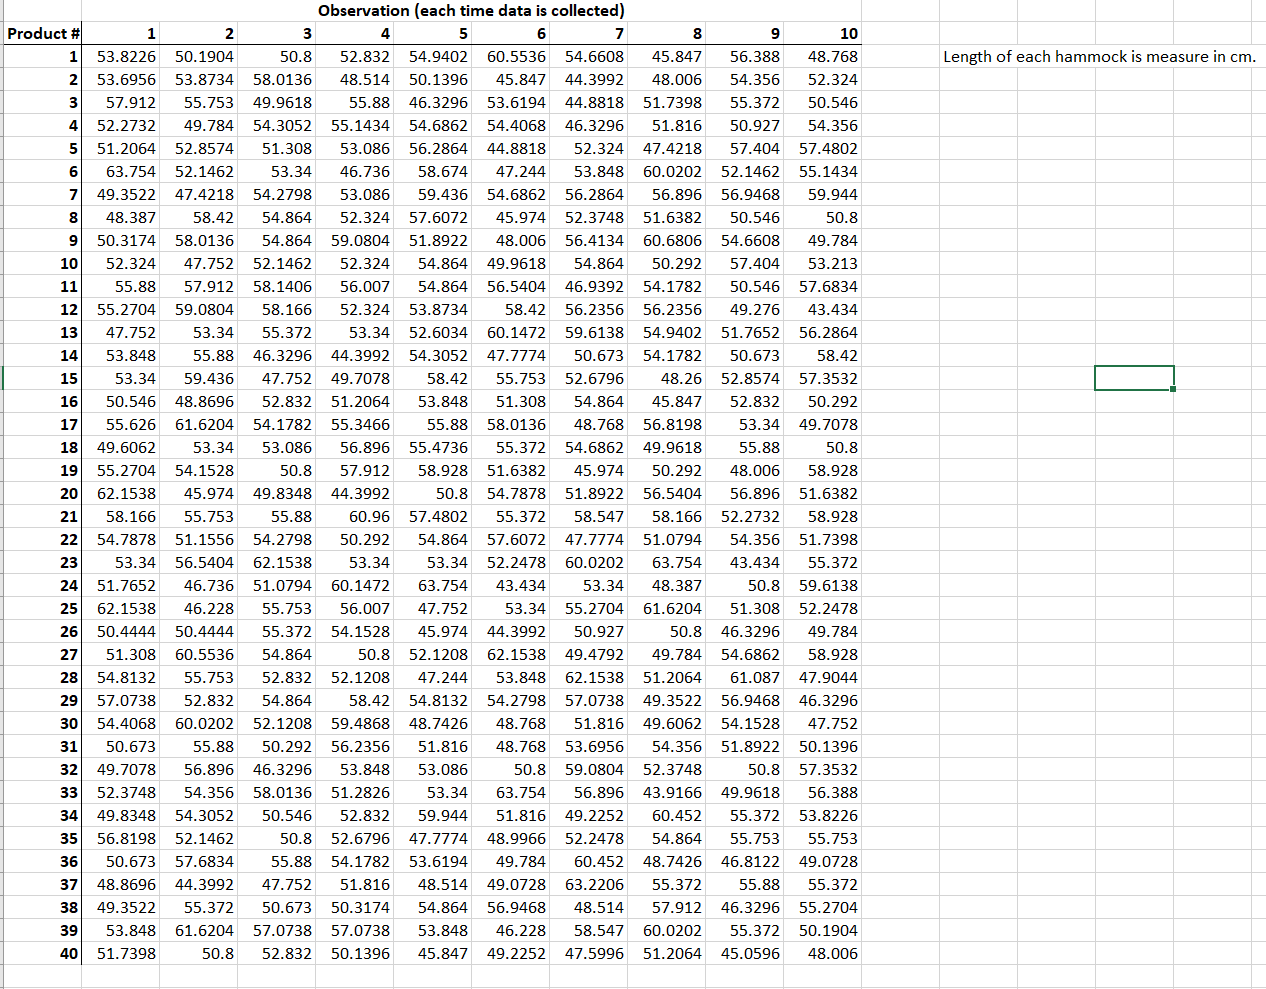
3. The company's product specifications state that their hammocks are guaranteed to be between 48.26 and 53.34 cm long.
Report the Cp and Cpk for Dan's cat hammock production. What current sigma level is their process at? What does this mean about the current process?
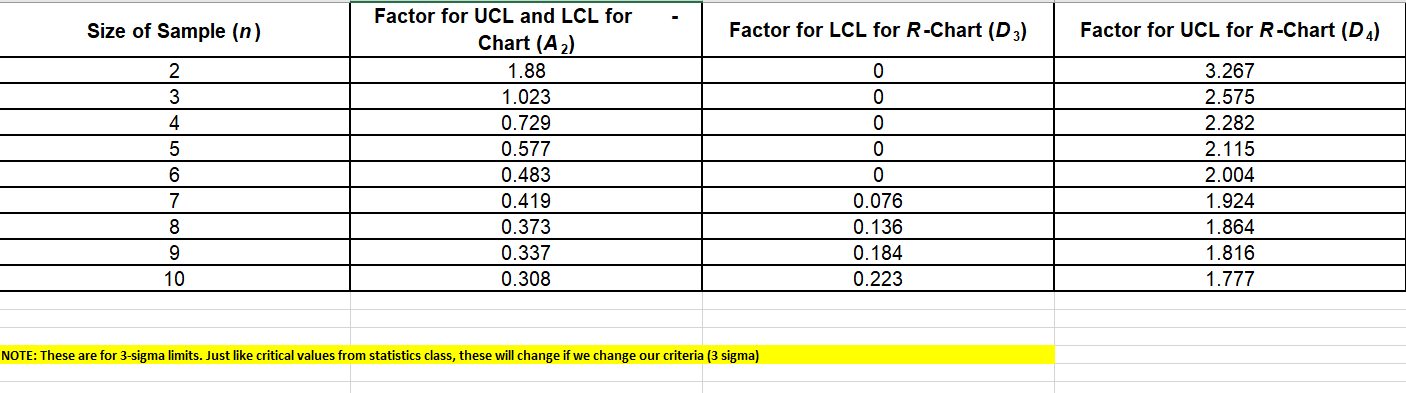
50.8 Length of each hammock is measure in cm. O Product #1 53.8226 2 53.6956 3 57.912 4 52.2732 5 51.2064 6 63.754 7 49.3522 8 48.387 9 50.3174 10 52.324 11 55.88 12 55.2704 13 47.752 14 53.848 15 53.34 16 50.546 17 55.626 18 49.6062 19 55.2704 20 62.1538 21 58.166 22 54.7878 23 53.34 24 51.7652 25 62.1538 26 50.4444 27 51.308 28 54.8132 29 57.0738 30 54.4068 31 50.673 32 49.7078 33 52.3748 34 49.8348 35 56.8198 36 50.673 37 48.8696 38 49.3522 39 53.848 40 51.7398 Observation (each time data is collected) 2 3 4 5 6 7 50.1904 52.832 54.9402 60.5536 54.6608 53.8734 58.0136 48.514 50.1396 45.847 44.3992 55.753 49.9618 55.88 46.3296 53.6194 44.8818 49.784 54.3052 55.1434 54.6862 54.4068 46.3296 52.8574 51.308 53.086 56.2864 44.8818 52.324 52.1462 53.34 46.736 58.674 47.244 53.848 47.4218 54.2798 53.086 59.436 54.6862 56.2864 58.42 54.864 52.324 57.6072 45.974 52.3748 58.0136 54.864 59.0804 51.8922 48.006 56.4134 47.752 52.1462 52.324 54.864 49.9618 54.864 57.912 58.1406 56.007 54.864 56.5404 46.9392 59.0804 58.166 52.324 53.8734 58.42 56.2356 53.34 55.372 53.34 52.6034 60.1472 59.6138 55.88 46.3296 44.3992 54.3052 47.7774 50.673 59.436 47.752 49.7078 58.42 55.753 52.6796 48.8696 52.832 51.2064 53.848 51.308 54.864 61.6204 54.1782 55.3466 55.88 58.0136 48.768 53.34 53.086 56.896 55.4736 55.372 54.6862 54.1528 50.8 57.912 58.928 51.6382 45.974 45.974 49.8348 44.3992 50.8 54.7878 51.8922 55.753 55.88 60.96 57.4802 55.372 58.547 51.1556 54.2798 50.292 54.864 57.6072 47.7774 56.5404 62.1538 53.34 53.34 52.2478 60.0202 46.736 51.0794 60.1472 63.754 43.434 53.34 46.228 55.753 56.007 47.752 53.34 55.2704 50.4444 55.372 54.1528 45.974 44.3992 50.927 60.5536 54.864 50.8 52.1208 62.1538 49.4792 55.753 52.832 52.1208 47.244 53.848 62.1538 52.832 54.864 58.42 54.8132 54.2798 57.0738 60.0202 52.1208 59.4868 48.7426 48.768 51.816 55.88 50.292 56.2356 51.816 48.768 53.6956 56.896 46.3296 53.848 53.086 50.8 59.0804 54.356 58.0136 51.2826 53.34 63.754 56.896 54.3052 50.546 52.832 59.944 51.816 49.2252 52.1462 50.8 52.6796 47.7774 48.9966 52.2478 57.6834 55.88 54.1782 53.6194 49.784 60.452 44.3992 47.752 51.816 48.514 49.0728 63.2206 55.372 50.673 50.3174 54.864 56.9468 48.514 61.6204 57.0738 57.0738 53.848 46.228 58.547 50.8 52.832 50.1396 45.847 49.2252 47.5996 8 9 45.847 56.388 48.006 54.356 51.7398 55.372 51.816 50.927 47.4218 57.404 60.0202 52.1462 56.896 56.9468 51.6382 50.546 60.6806 54.6608 50.292 57.404 54.1782 50.546 56.2356 49.276 54.9402 51.7652 54.1782 50.673 48.26 52.8574 45.847 52.832 56.8198 53.34 49.9618 55.88 50.292 48.006 56.5404 56.896 58.166 52.2732 51.0794 54.356 63.754 43.434 48.387 50.8 61.6204 51.308 50.8 46.3296 49.784 54.6862 51.2064 61.087 49.3522 56.9468 49.6062 54.1528 54.356 51.8922 52.3748 50.8 43.9166 49.9618 60.452 55.372 54.864 55.753 48.7426 46.8122 55.372 55.88 57.912 46.3296 60.0202 55.372 51.2064 45.0596 10 48.768 52.324 50.546 54.356 57.4802 55.1434 59.944 50.8 49.784 53.213 57.6834 43.434 56.2864 58.42 57.3532 50.292 49.7078 50.8 58.928 51.6382 58.928 51.7398 55.372 59.6138 52.2478 49.784 58.928 47.9044 46.3296 47.752 50.1396 57.3532 56.388 53.8226 55.753 49.0728 55.372 55.2704 50.1904 48.006 Size of Sample (n) Factor for LCL for R-Chart (D3) Factor for UCL for R-Chart (DA) 2 3 0 0 4 0 5 Factor for UCL and LCL for Chart (A2) 1.88 1.023 0.729 0.577 0.483 0.419 0.373 0.337 0.308 0 6 3.267 2.575 2.282 2.115 2.004 1.924 1.864 1.816 1.777 7 0 0.076 0.136 0.184 0.223 8 9 10 NOTE: These are for 3-sigma limits. Just like critical values from statistics class, these will change if we change our criteria (3 sigma)Step by Step Solution
There are 3 Steps involved in it
1 Expert Approved Answer
Step: 1 Unlock

Question Has Been Solved by an Expert!
Get step-by-step solutions from verified subject matter experts
Step: 2 Unlock
Step: 3 Unlock