

Question: 1. Use a frequency distribution table to numerically summarize the variable Branch in the BUSI1013 Bank Dataset.xlsx data set (from Unit 1 Exercise Question 2).
1. Use a frequency distribution table to numerically summarize the variable Branch
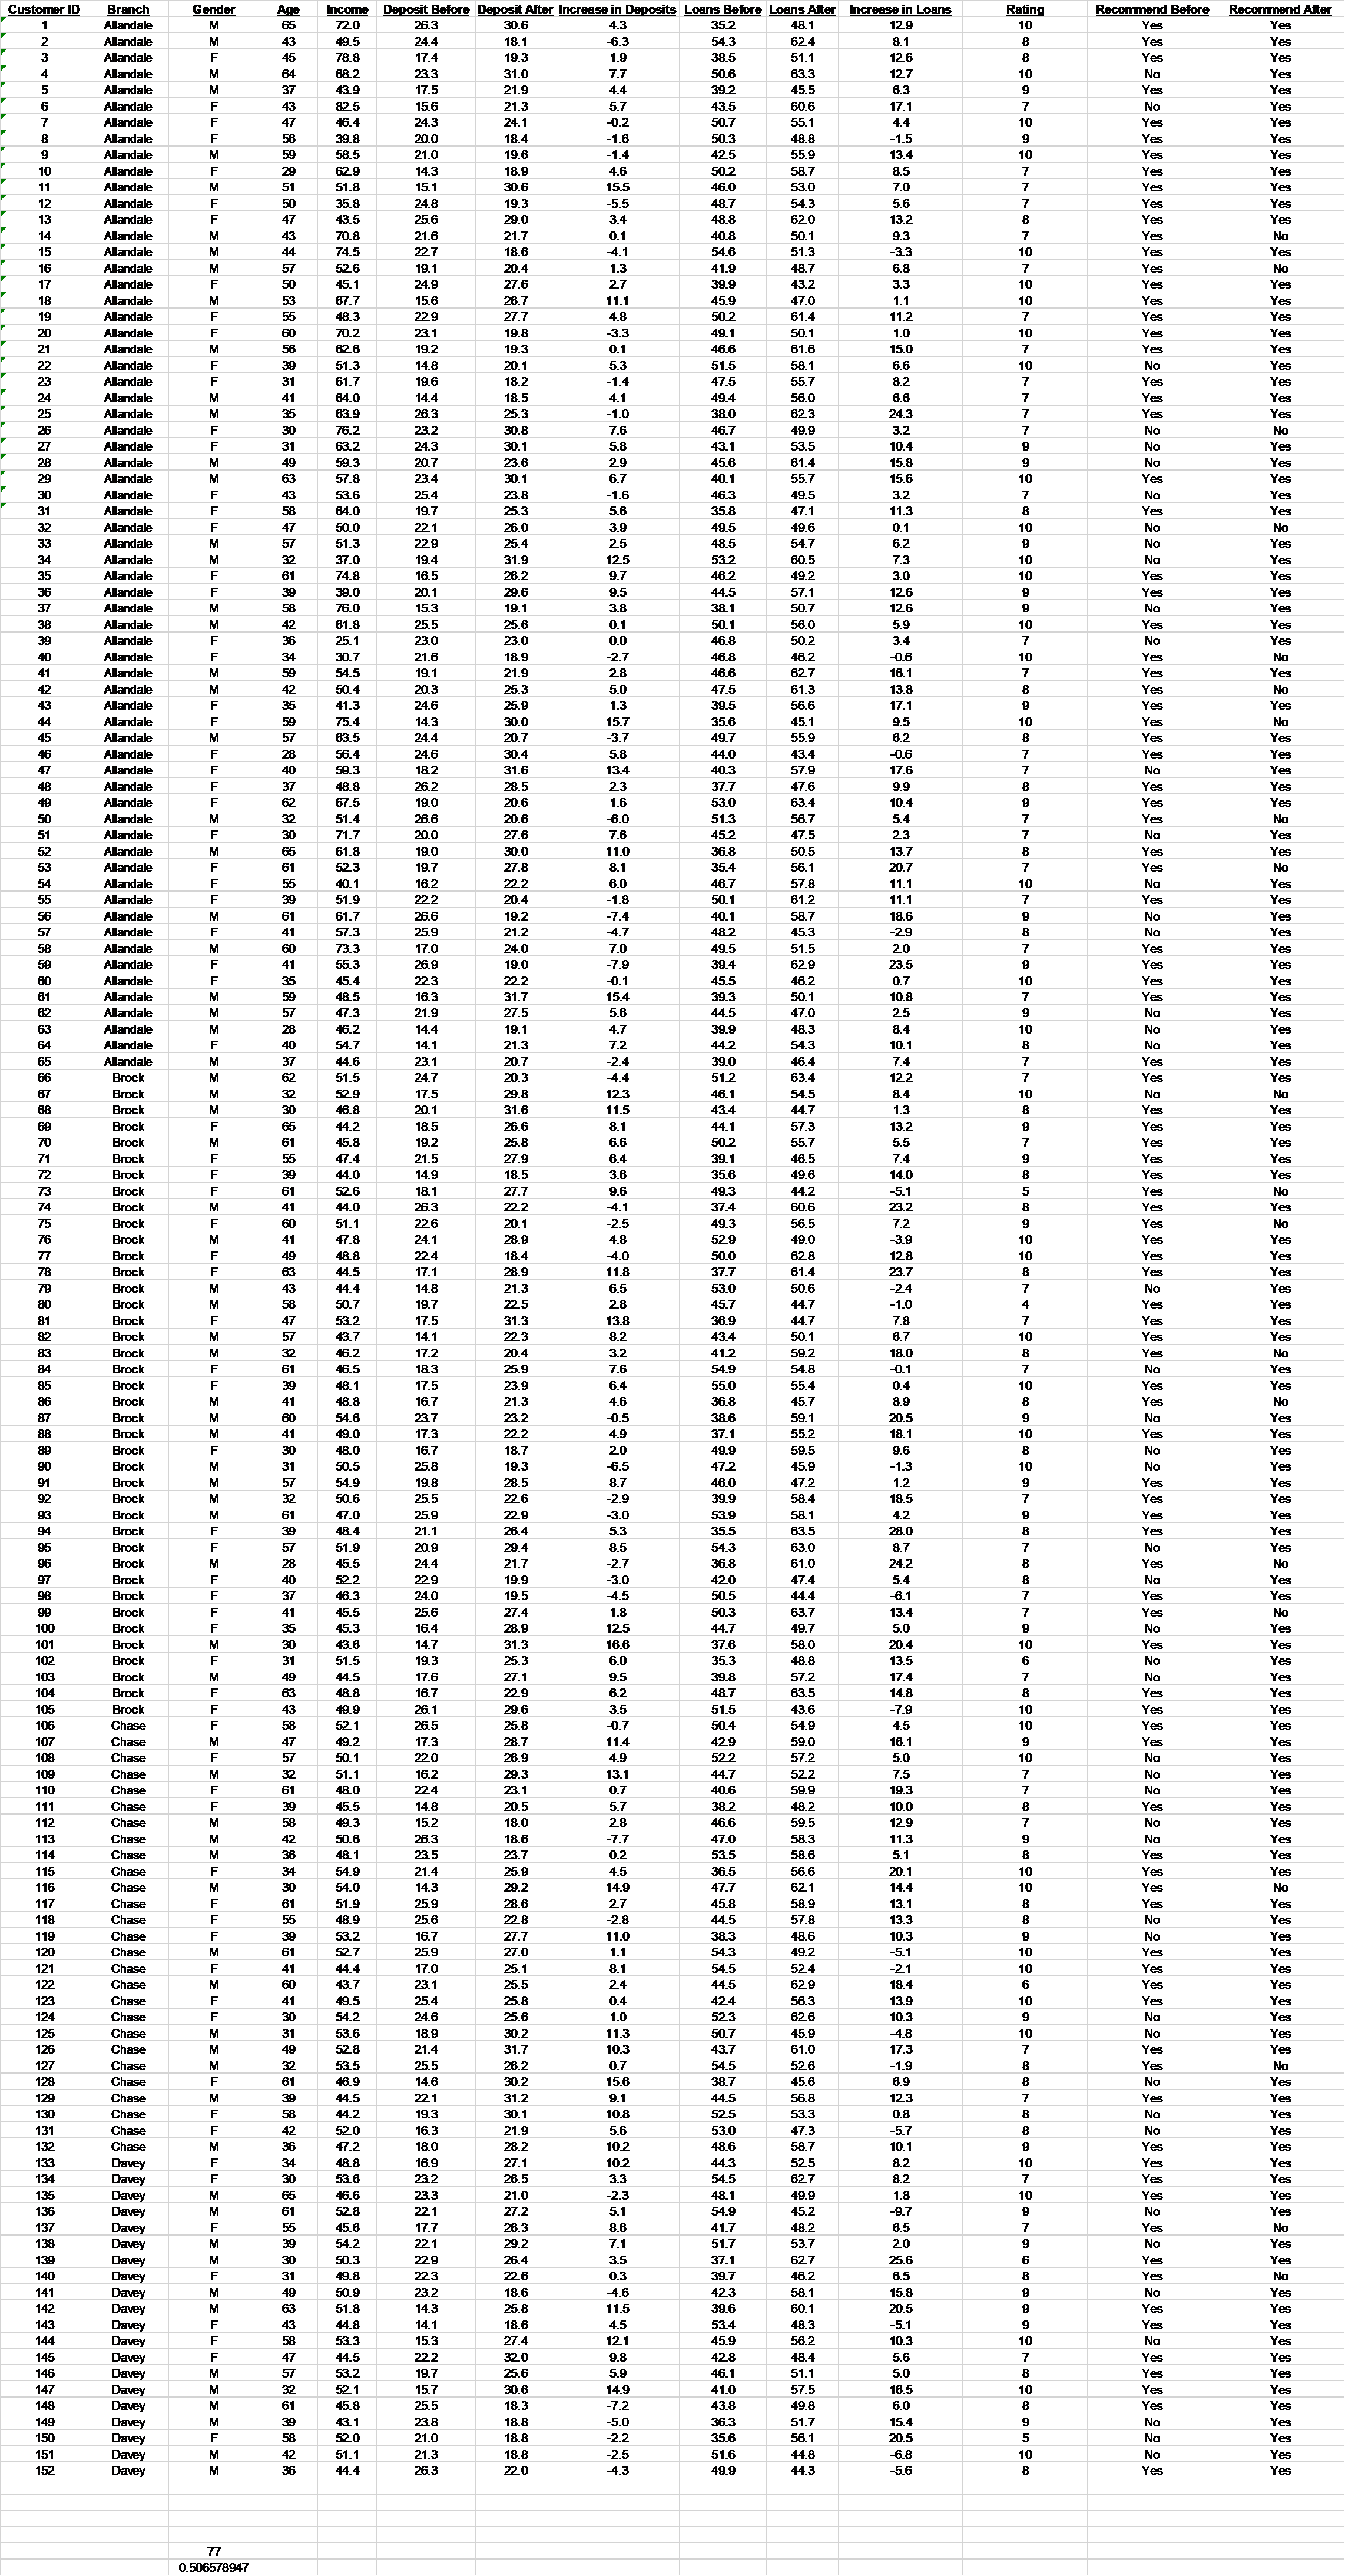
in the BUSI1013 Bank Dataset.xlsx data set (from Unit 1 Exercise Question 2). Based on the table, use a pie chart to summarize this variable graphically.
\f
Step by Step Solution
There are 3 Steps involved in it
1 Expert Approved Answer
Step: 1 Unlock

Question Has Been Solved by an Expert!
Get step-by-step solutions from verified subject matter experts
Step: 2 Unlock
Step: 3 Unlock