

Question: 1. Use a variable showing whether parents were very involved or not very involved as reported by the childs kindergarten teacher (t2parinr) in the spring
1. Use a variable showing whether parents were very involved or not very involved as reported by the childs kindergarten teacher (t2parinr) in the spring of kindergarten as the dependent variable. You will use the number of siblings in the home (X1NUMSIB) as your independent variable of interest.
2. Write a research question that you would use to address the relationship between these variables.
3. Write a hypothesis to go with your research question. Is it directional or non-directional?
4. Run a logistic regression testing whether more siblings in the home predicts a decrease or increase in likelihood of having a parent that is very involved at school.
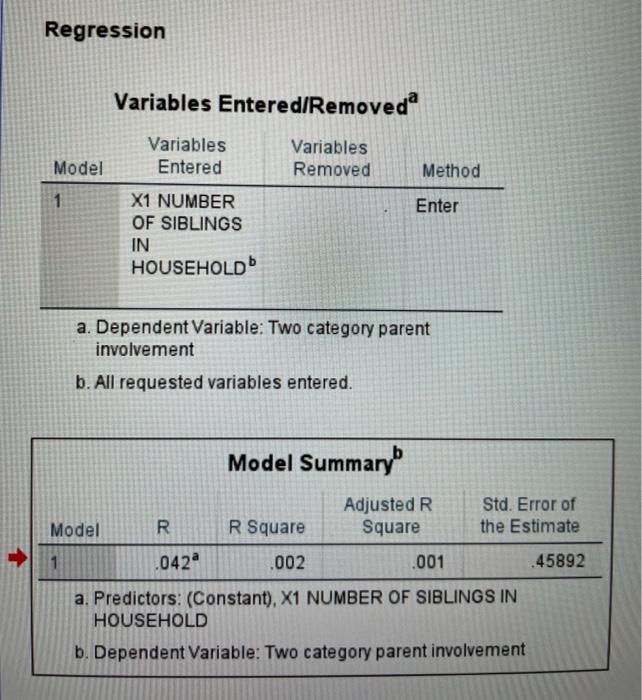
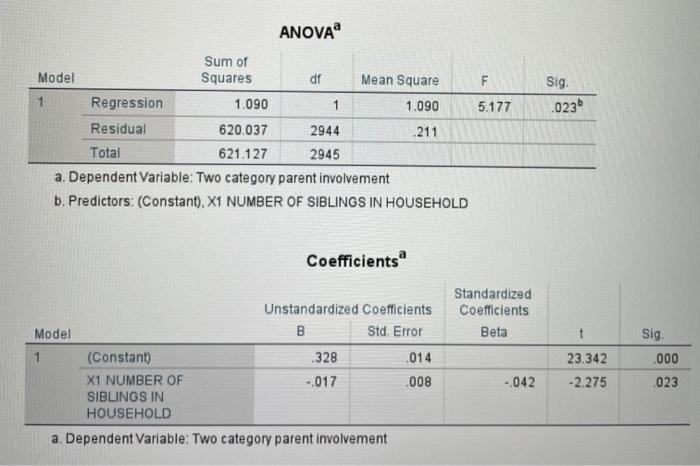
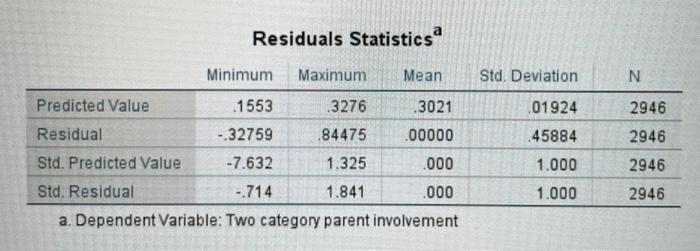
5. What is the sample size?
6. What is the regression coefficient? Is it statistically significant?
7. What is the odds ratio?
8. Interpret the odds ratio by turning it in to a percent. What does it mean for the likelihood of whether the childs parent is very involved?
Regression Variables Entered/Removeda Variables Entered Variables Removed Model Method 1 Enter X1 NUMBER OF SIBLINGS IN HOUSEHOLD a. Dependent Variable: Two category parent involvement b. All requested variables entered. Model Summary Adjusted R Square Std. Error of the Estimate Model R R Square .042 .002 .001 .45892 a. Predictors: (Constant), X1 NUMBER OF SIBLINGS IN HOUSEHOLD b. Dependent Variable: Two category parent involvement ANOVA Sig .0236 5.177 Sum of Model Squares df Mean Square Regression 1.090 1 1.090 Residual 620.037 2944 211 Total 621.127 2945 a. Dependent Variable: Two category parent involvement b. Predictors: (Constant), X1 NUMBER OF SIBLINGS IN HOUSEHOLD Coefficients Standardized Coefficients Beta Unstandardized Coefficients Model B Std. Error (Constant) .328 .014 X1 NUMBER OF -017 .008 SIBLINGS IN HOUSEHOLD a. Dependent Variable: Two category parent involvement 23.342 -2.275 Sig .000 023 -.042 Residuals Statistics Minimum Maximum Mean Std. Deviation N 2946 Predicted Value .1553 .3276 13021 Residual - 32759 .84475 .00000 Std. Predicted Value -7.632 1.325 .000 Std. Residual - 714 1.841 .000 a. Dependent Variable: Two category parent involvement .01924 .45884 1.000 2946 2946 1.000 2946 Scatterplot Dependent Variable: Two category parent involvement 20 1.5 10 05 Regression Standardized Residual 0.0 -0.5 O -10 -8 -2 0 2 Regression Standardized Predicted Value
Step by Step Solution
There are 3 Steps involved in it

Get step-by-step solutions from verified subject matter experts