

Question: 1. Use R to perform the requested inference. (a) The dataset SummerStudents.xlsx is a file that contains information from a random sample of 44
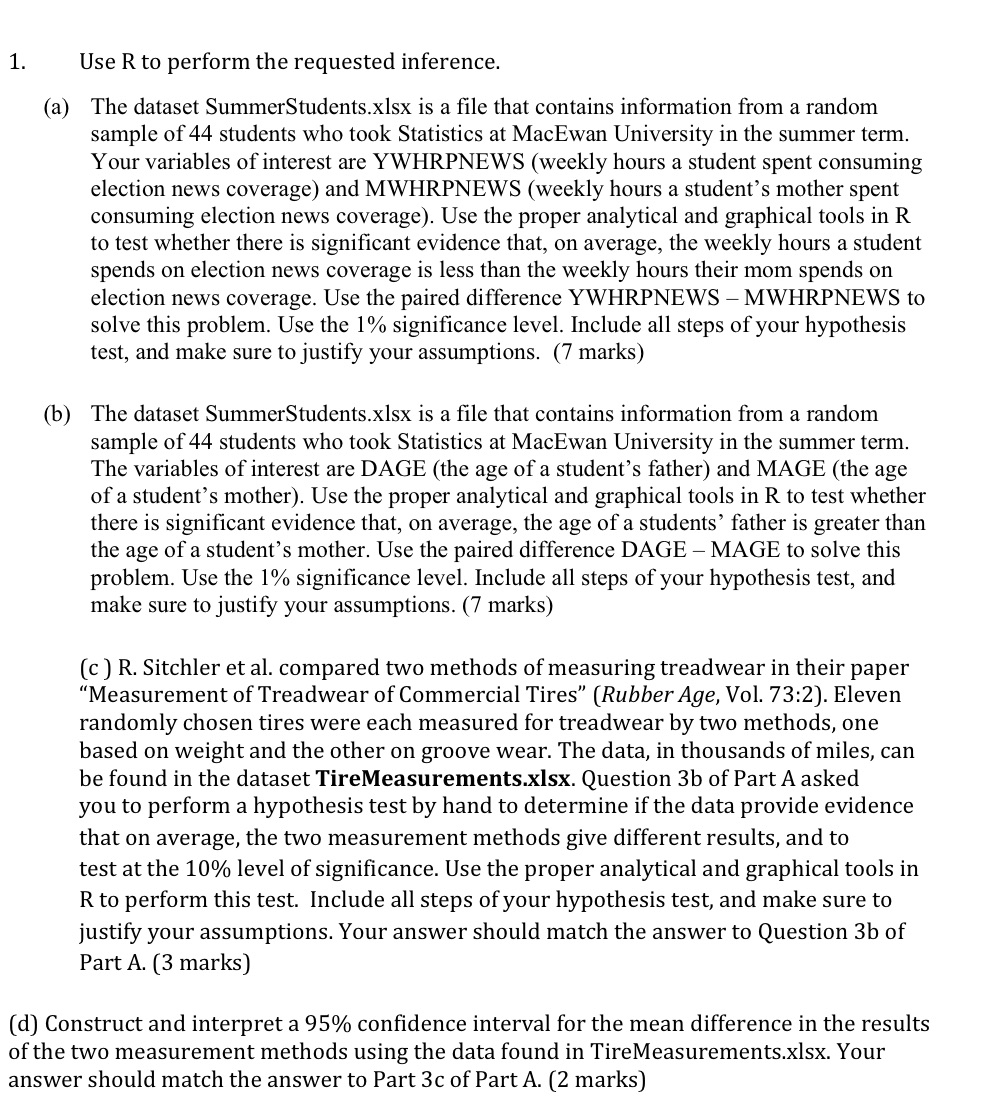
1. Use R to perform the requested inference. (a) The dataset SummerStudents.xlsx is a file that contains information from a random sample of 44 students who took Statistics at MacEwan University in the summer term. Your variables of interest are YWHRPNEWS (weekly hours a student spent consuming election news coverage) and MWHRPNEWS (weekly hours a student's mother spent consuming election news coverage). Use the proper analytical and graphical tools in R to test whether there is significant evidence that, on average, the weekly hours a student spends on election news coverage is less than the weekly hours their mom spends on election news coverage. Use the paired difference YWHRPNEWS - MWHRPNEWS to solve this problem. Use the 1% significance level. Include all steps of your hypothesis test, and make sure to justify your assumptions. (7 marks) (b) The dataset SummerStudents.xlsx is a file that contains information from a random sample of 44 students who took Statistics at MacEwan University in the summer term. The variables of interest are DAGE (the age of a student's father) and MAGE (the age of a student's mother). Use the proper analytical and graphical tools in R to test whether there is significant evidence that, on average, the age of a students' father is greater than the age of a student's mother. Use the paired difference DAGE - MAGE to solve this problem. Use the 1% significance level. Include all steps of your hypothesis test, and make sure to justify your assumptions. (7 marks) (c) R. Sitchler et al. compared two methods of measuring treadwear in their paper "Measurement of Treadwear of Commercial Tires" (Rubber Age, Vol. 73:2). Eleven randomly chosen tires were each measured for treadwear by two methods, one based on weight and the other on groove wear. The data, in thousands of miles, can be found in the dataset TireMeasurements.xlsx. Question 3b of Part A asked you to perform a hypothesis test by hand to determine if the data provide evidence that on average, the two measurement methods give different results, and to test at the 10% level of significance. Use the proper analytical and graphical tools in R to perform this test. Include all steps of your hypothesis test, and make sure to justify your assumptions. Your answer should match the answer to Question 3b of Part A. (3 marks) (d) Construct and interpret a 95% confidence interval for the mean difference in the results of the two measurement methods using the data found in TireMeasurements.xlsx. Your answer should match the answer to Part 3c of Part A. (2 marks)
Step by Step Solution
There are 3 Steps involved in it

Get step-by-step solutions from verified subject matter experts