

Question: 1. Use the data from the table to create a line graph on the axes below. Be sure to title and label your graph. Include
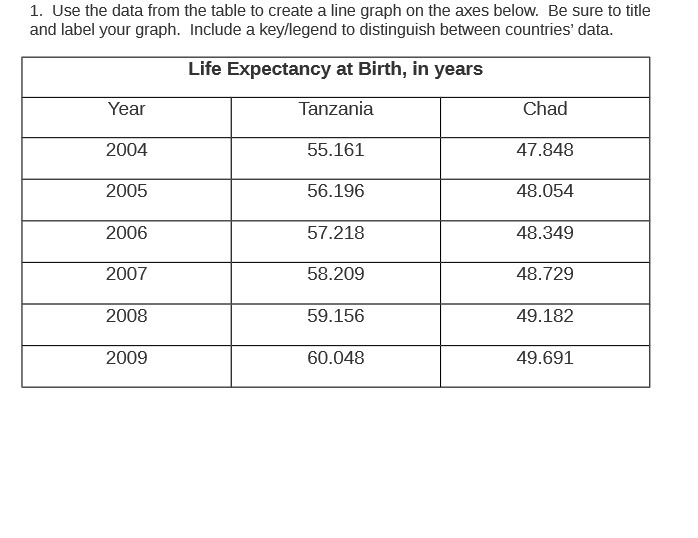
1. Use the data from the table to create a line graph on the axes below. Be sure to title and label your graph. Include a key/legend to distinguish between countries' data. Life Expectancy at Birth, in years Year Tanzania Chad 2004 55.161 47.848 2005 56.196 48.054 2006 57.218 48.349 2007 58.209 48.729 2008 59.156 49.182 2009 60.048 49.691
Step by Step Solution
There are 3 Steps involved in it
1 Expert Approved Answer
Step: 1 Unlock

Question Has Been Solved by an Expert!
Get step-by-step solutions from verified subject matter experts
Step: 2 Unlock
Step: 3 Unlock