

Question: 1) Use the data in the following table, which lists drive-thru order accuracy at popular fast food chains. Assume that orders are randomly selected from


1)
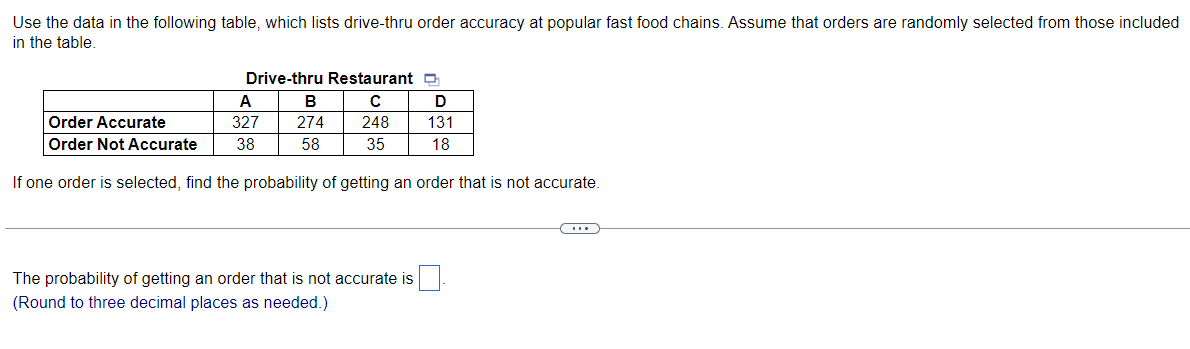


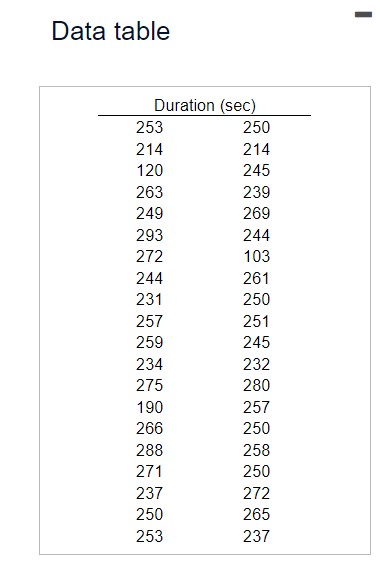


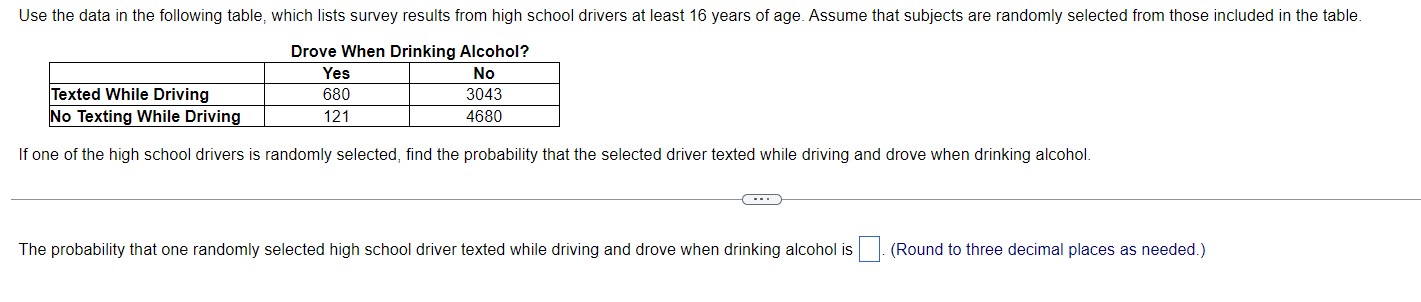
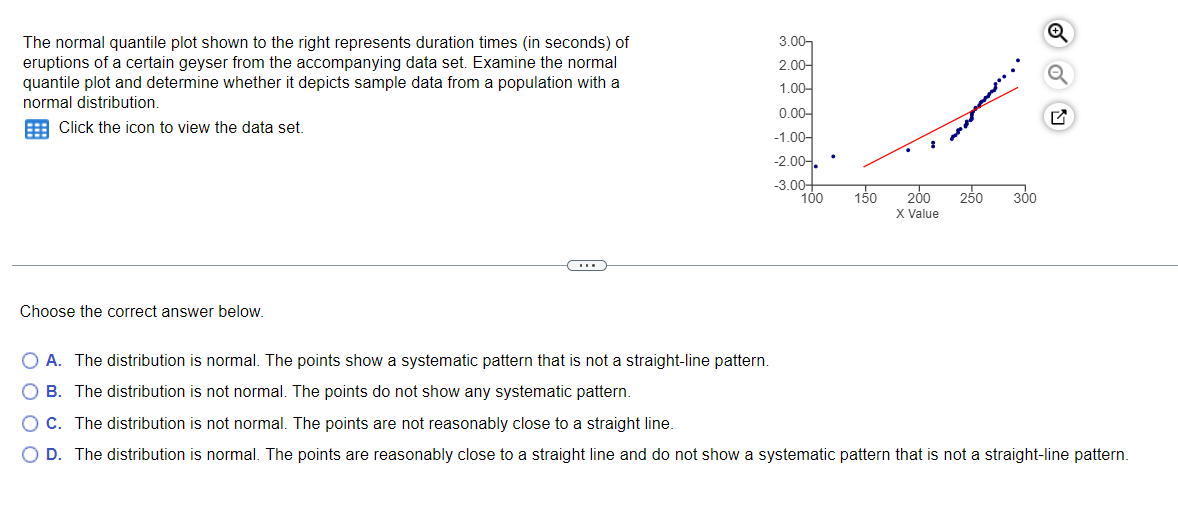
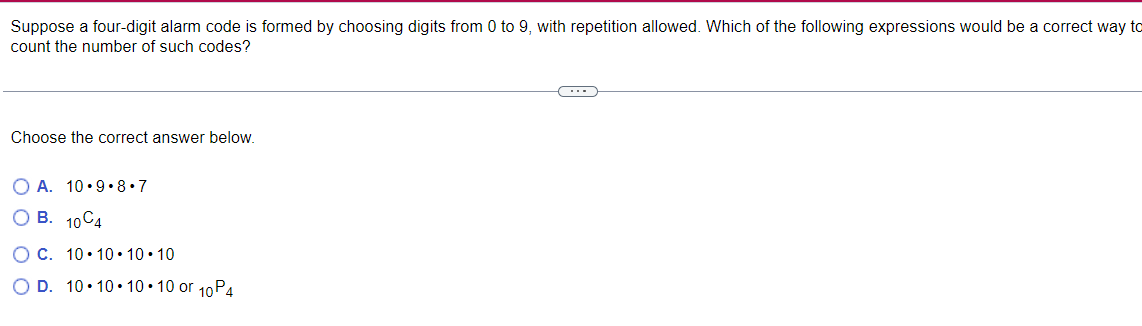
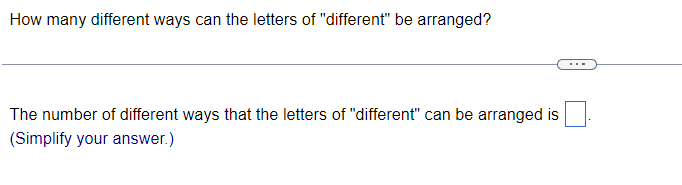
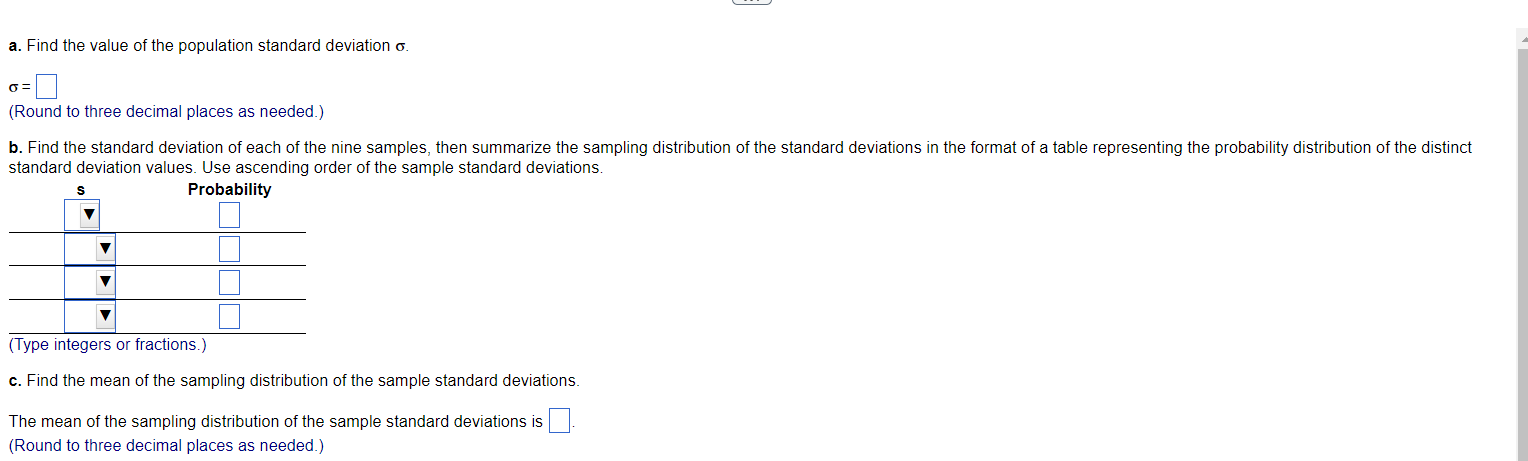
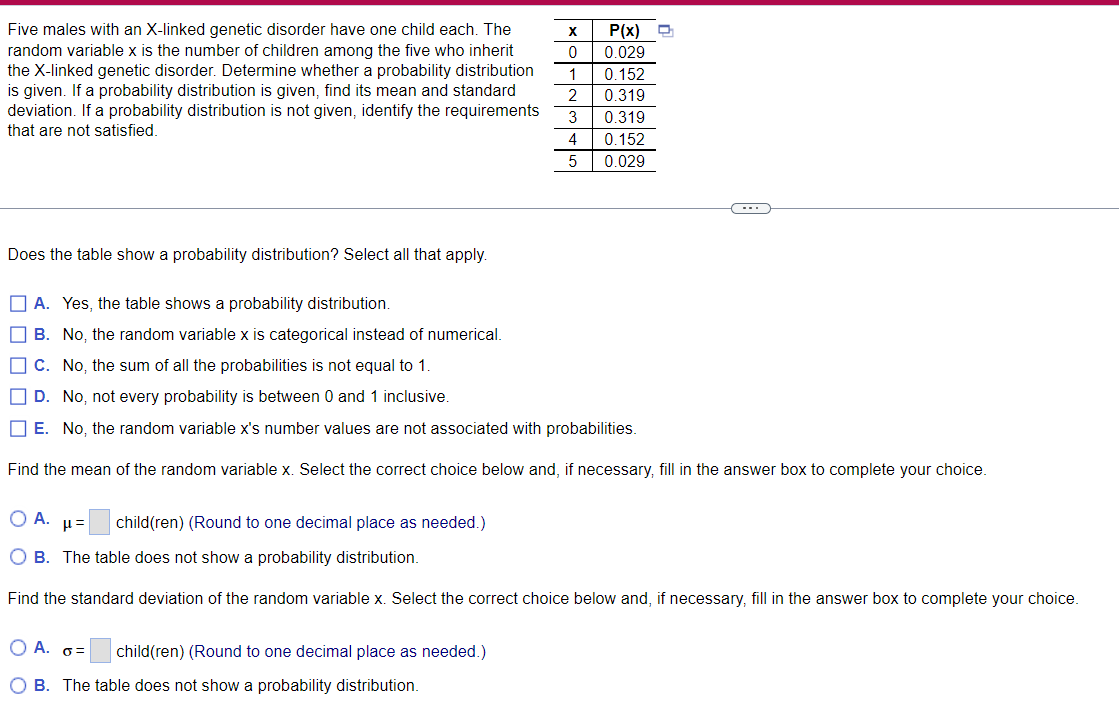
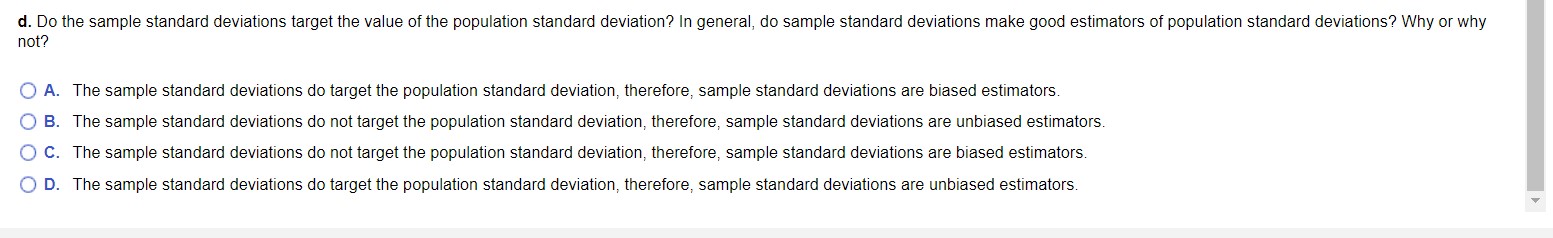
Use the data in the following table, which lists drive-thru order accuracy at popular fast food chains. Assume that orders are randomly selected from those included in the table. Drive-thru Restaurant A B C D Order Accurate 327 274 248 131 Order Not Accurate 38 58 35 18 If one order is selected, find the probability of getting an order that is not accurate. The probability of getting an order that is not accurate is (Round to three decimal places as needed.)The normal quantile plot shown to the right represents duration times (in seconds} of 3.0 9' eruptions of a certain geyser from the accompanying data set. Examine the normal 20 _' quantile plot and determine whether it depicts sample data from a population with a 1 o ' Q normal distribution. E Click the icon to View the data set. Choose the correct answer below. 0 A. "he distribution is normal. The points show a systematic pattern that is not a straight-line pattern. 0 B. "he distribution is not normal. The points do not show any systematic pattern. 0 C. "he distribution is not normal. The points are not reasonably close to a straight line. O D. "he distribution is normal. The points are reasonably close to a straight line and do not show a systematic pattern that is not a straightline pattern. Suppose a fourdigit alarm code is formed by choosing digits from 0 to 9, with repetition allowed. Which of the following expressions would be a correct way to count the number of such codes? Choose the correct answer below. OA. 10-9-3-7 03- 1004 OC. 10'10'10'10 OD. 10-10-10-100r10P4 HOW many different ways can the letters of "different" be arranged? E: The number at different ways that the letters at \"different" can be arranged is D {Simplify your answer} a. Find the value of the population standard deviation o. (Round to three decimal places as needed.) b. Find the standard deviation of each of the nine samples, then summarize the sampling distribution of the standard deviations in the format of a table representing the probability distribution of the distinct standard deviation values. Use ascending order of the sample standard deviations. Probability (Type integers or fractions.) c. Find the mean of the sampling distribution of the sample standard deviations. The mean of the sampling distribution of the sample standard deviations is. (Round to three decimal places as needed.)Five males with an Xlinked genetic disorder have one child each. The random variable x is the number of children among the ve who inherit the X-linked genetic disorder. Determine whether a probability distribution is given. If a probability distribution is given, nd its mean and standard deviation. If a probability distribution is not given, identify the requirements that are not satised. 0 U s
Step by Step Solution
There are 3 Steps involved in it

Get step-by-step solutions from verified subject matter experts