

Question: 1. Use the dataset immigrationdta and Stata for this problem. This dataset comes from the 2015 American Community Survey. All variables are coded. Observations come
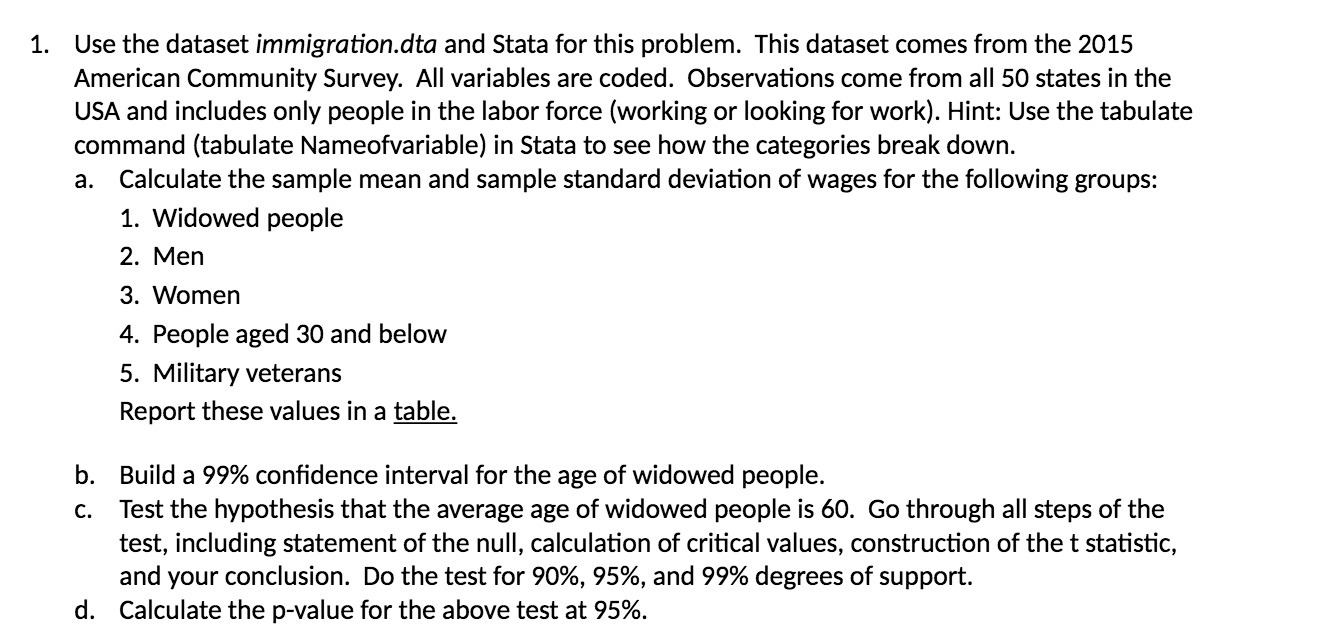
1. Use the dataset immigrationdta and Stata for this problem. This dataset comes from the 2015 American Community Survey. All variables are coded. Observations come from all 50 states in the USA and includes only people in the labor force (working or looking for work). Hint: Use the tabulate command (tabulate Nameofvariable) in Stata to see how the categories break down. a. Calculate the sample mean and sample standard deviation of wages for the following groups: 1. Widowed people 2. Men 3. Women 4. People aged 30 and below 5. Military veterans Report these values in a m b. Build a 99% condence interval for the age of widowed people. c. Test the hypothesis that the average age of widowed people is 60. Go through all steps of the test, including statement of the null, calculation of critical values, construction of the t statistic, and your conclusion. Do the test for 90%, 95%, and 99% degrees of support. d. Calculate the pvalue for the above test at 95%
Step by Step Solution
There are 3 Steps involved in it

Get step-by-step solutions from verified subject matter experts