

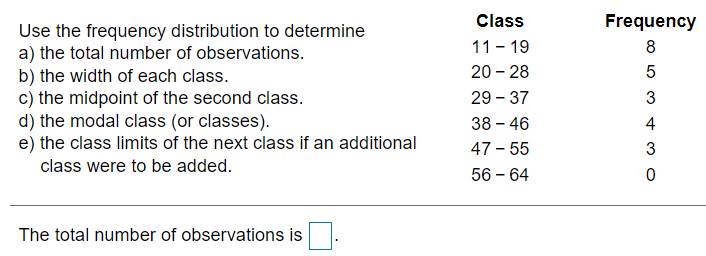
Question: 1) Use the frequencyr distribution to determine a} the total number of obsenrations. b} the width of each class. c) the midpoint of the second
1)
![second class. d] the modal class (or classes}. e} the class limits](https://s3.amazonaws.com/si.experts.images/answers/2024/06/667cda061fe5d_310667cda060e970.jpg)
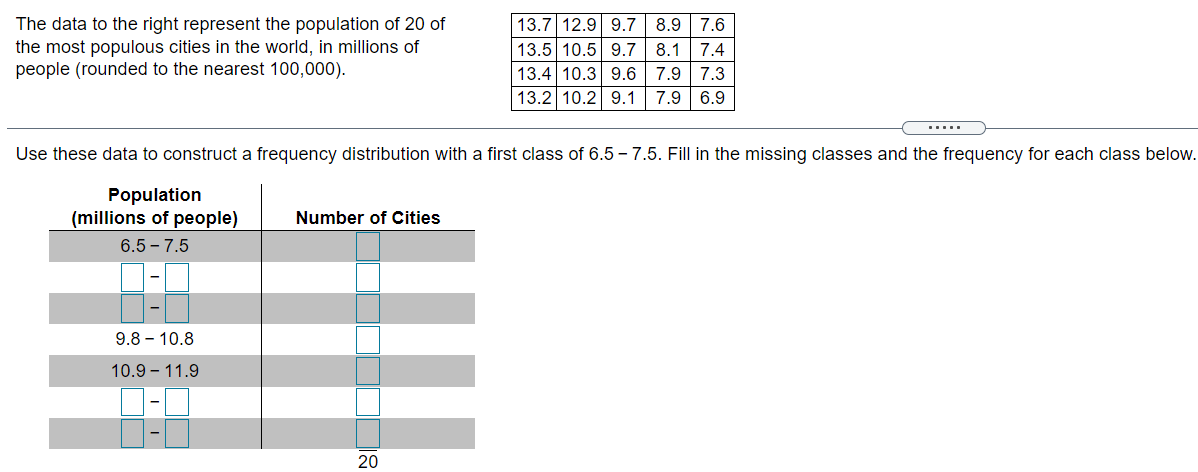
Use the frequencyr distribution to determine a} the total number of obsenrations. b} the width of each class. c) the midpoint of the second class. d] the modal class (or classes}. e} the class limits of the next class if an additional class were to be added. The total number of observations is B. Class 11-19 2023 293? 3846 4?55 5554 Frequency 8 DW-PI-WU'I The data to the right represent the population of 20 of 13.7 12.9 9.7 8.9 7.6 the most populous cities in the world, in millions of 13.5 10.5 9.7 8.1 7.4 people (rounded to the nearest 100,000). 13.4 10.3 9.6 7.9 7.3 13.2 10.2 9.1 7.9 6.9 . . . . . Use these data to construct a frequency distribution with a first class of 6.5 - 7.5. Fill in the missing classes and the frequency for each class below. Population (millions of people) Number of Cities 6.5- 7.5 9.8 - 10.8 10.9 -11.9 20Use the histogram below to answer the following questions. a} How many people were surveyed? b} How many people purchased four soft drinks? c} 1What is the medal class? d} How many soft drinks were purchased? e} Construct a frequency distribution from this histogram. Number of Soft Drinks Purchased at a Theater Nmnbe: of people Number of soft drinks purchased
Step by Step Solution
There are 3 Steps involved in it

Get step-by-step solutions from verified subject matter experts