

Question: 1. Use the graphing calculator to determine the numerical statistics and create a histogram with bin width 5 for the sample data shown below. Show
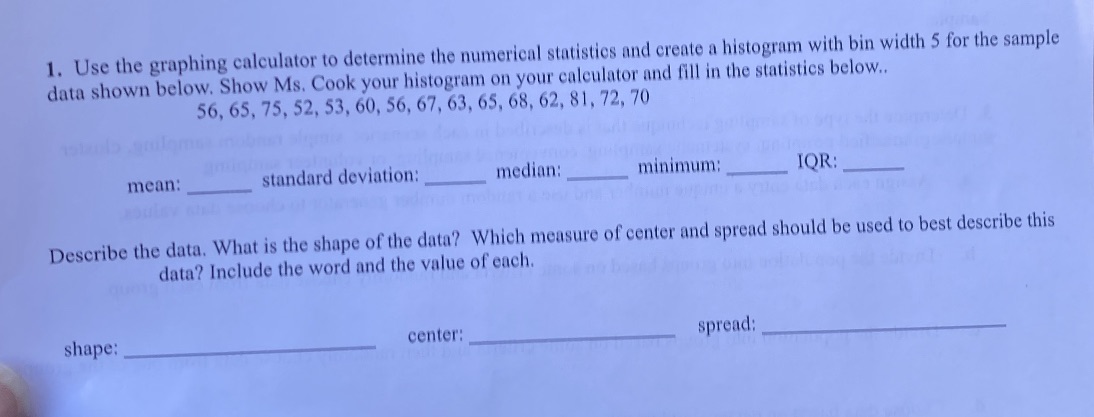
1. Use the graphing calculator to determine the numerical statistics and create a histogram with bin width 5 for the sample data shown below. Show Ms. Cook your histogram on your calculator and fill in the statistics below.. 56, 65, 75, 52, 53, 60, 56, 67, 63, 65, 68, 62, 81, 72, 70 mean: standard deviation: median: minimum: IOR: Describe the data. What is the shape of the data? Which measure of center and spread should be used to best describe this data? Include the word and the value of each. shape: center: spread
Step by Step Solution
There are 3 Steps involved in it
1 Expert Approved Answer
Step: 1 Unlock

Question Has Been Solved by an Expert!
Get step-by-step solutions from verified subject matter experts
Step: 2 Unlock
Step: 3 Unlock