

Question: 1. Use the operating projections and other assumptions provided for each project to compute the net present value (NPV), internal rate of return (IRR), payback
1. Use the operating projections and other assumptions provided for each project to compute the net present value (NPV), internal rate of return (IRR), payback period, 5 year cumulative EBITDA, and profitability index for each using the template provided.Read the entire New Heritage Doll Company case. From the information given:
2. Which project creates more value? Why?
3. How do the IRR, payback period, 5 year cumulative EBITDA, and profitability index compare to NPV as tools for evaluating projects? When and how would you use each?
4. If Harris is forced to recommend one project over the other, which should she recommend? Why?
5. Elizabeth Holtz, brand manager for the Heirloom Dolls division planned to use existing IT staff to develop the web-based software tools and order entry system required for the Design Your Own Doll Project. These costs were not included in the initial outlays or forecast presented as the development personnel Holtz needed were considered corporate resources. Do you agree or disagree? If these costs were included would it change your answer to question 4?
Data Below:
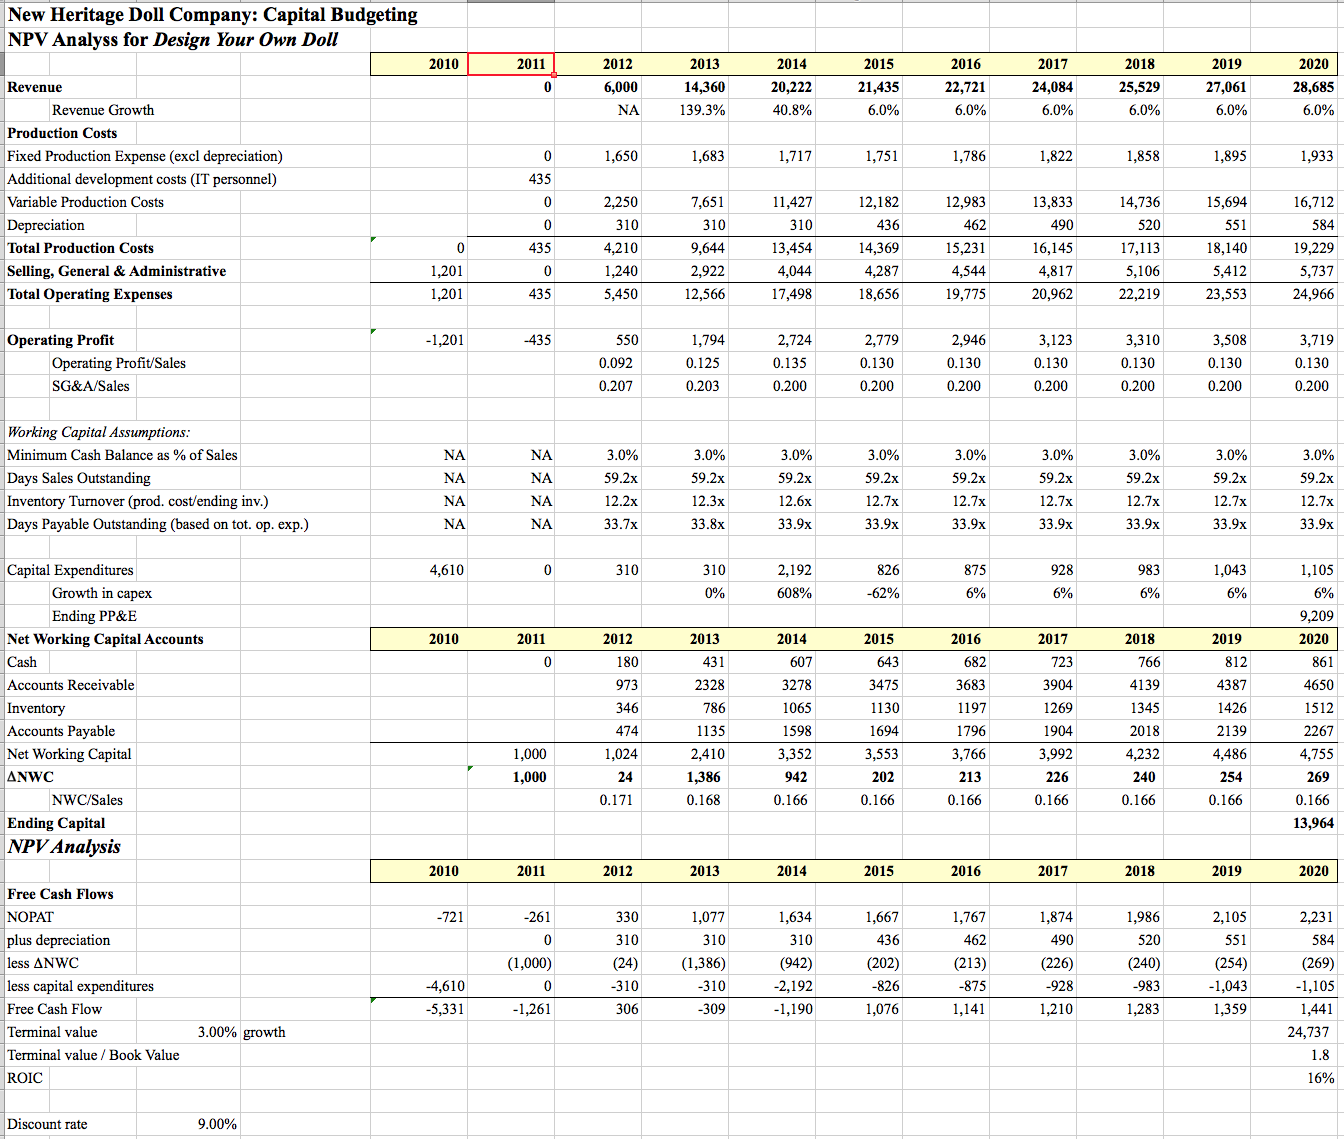
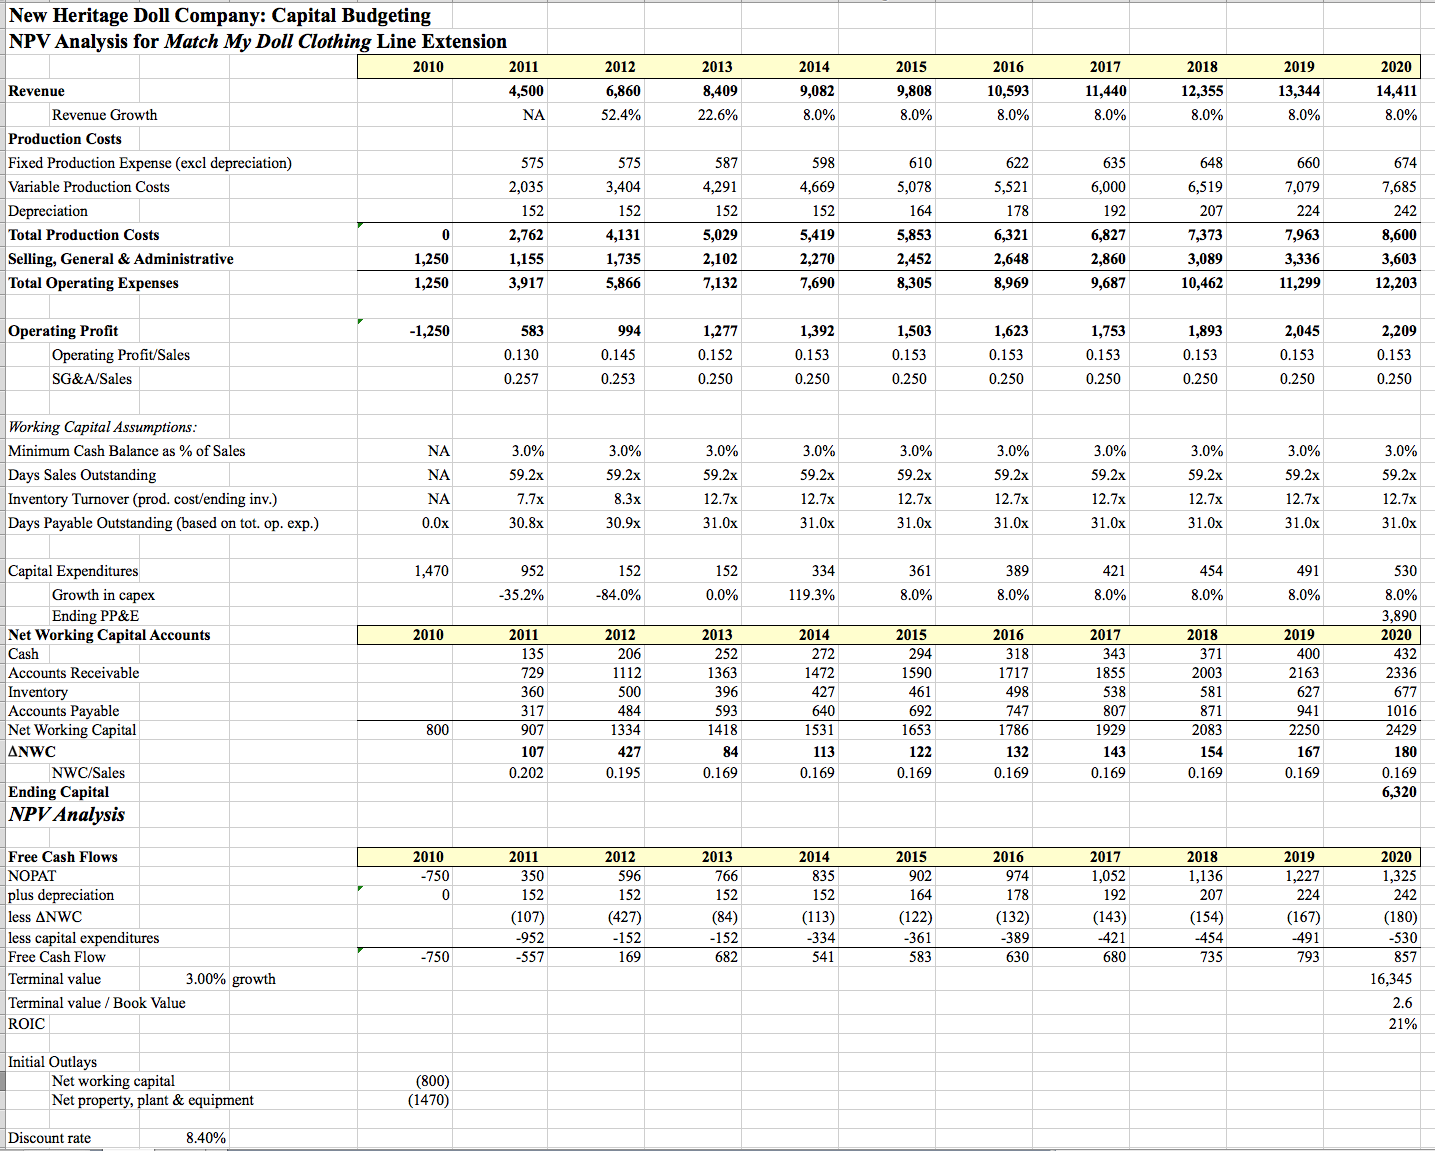
New Heritage Doll Company: Capital Budgeting NPV Analyss for Design Your Own Doll 2010 2019 2020 28,685 2013 2018 evenue 6,000 20,222 22,721 Revenue Growthh 139.3% Production Costs Fixed Production Expense (excl depreciation) Additional development costs (IT personnel) Variable Production Costs Depreciation Total Production Costs Selling, General & Administrative Total Operating Expenses 1,683 1,786 1,895 12,983 13,833 14,736 520 17,113 11,427 16,712 15,231 19,229 1,201 1,201 5,737 17,498 18,656 19,775 20,962 2,779 0.130 0.200 3,719 0.130 0.200 Operating Profit -1,201 2,724 3,123 0.092 0.207 0.130 0.130 Operating Profit/Sales SG&A/Sales 0.203 0.200 0.200 0.200 0.200 0.200 Working Capital Assumptions Minimum Cash Balance as % of Sales Days Sales Outstanding Inventory Turnover (prod. cost/ending inv.) Days Payable Outstanding (based on tot. op. exp.) 59.2x 12.2x 59.2x 59.2x 59.2x 59.2x 59.2x 59.2x 59.2x 59.2x 2,192 928 -62% Ending PP&E Net Working Capital Accounts 2010 2020 3278 1065 1598 4387 1426 Accounts Receivable 973 3475 3904 1269 1904 3,992 3683 4650 694 2267 Net Working Capital .VWC 1,024 3,766 4,755 NWC/Sales NPV Analysis 2010 2020 Free Cash Flows NOPAT plus depreciation less NWC less capital expenditures Free Cash Flow Terminal value Terminal value Book Value ROIC 1,077 1,634 1,667 1,767 1,986 520 24) -4,610 2,192 -1,261 309 1,076 3.00% growth 24,737 16% Discount rate 9.00%
Step by Step Solution
There are 3 Steps involved in it

Get step-by-step solutions from verified subject matter experts