

Question: '1 Use the returns data below for two stocks, construct a mean-variance efficient frontier. (1) Calculate the covariances of two assets (2) For each of
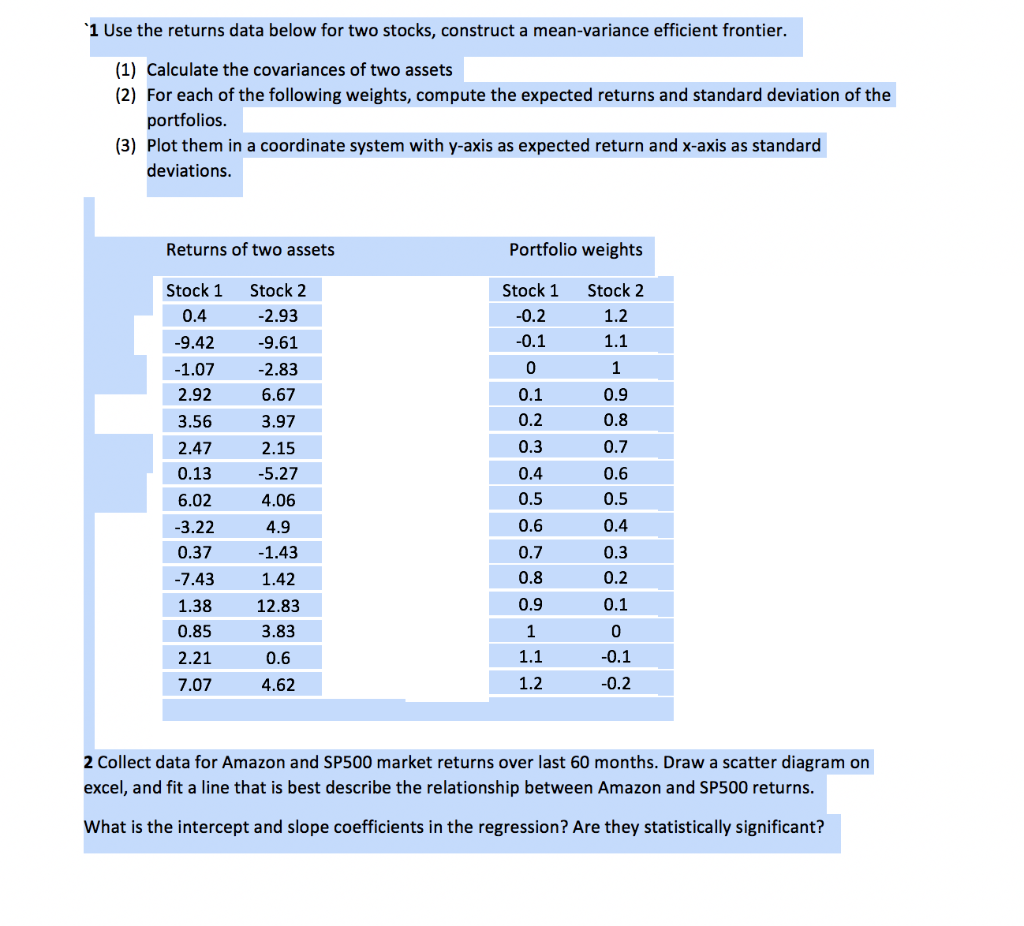
'1 Use the returns data below for two stocks, construct a mean-variance efficient frontier. (1) Calculate the covariances of two assets (2) For each of the following weights, compute the expected returns and standard deviation of the portfolios. (3) Plot them in a coordinate system with y-axis as expected return and x-axis as standard deviations. Returns of two assets Portfolio weights Stock 1 -0.2 Stock 2 1.2 1.1 -0.1 0 1 0.9 0.1 0.2 0.8 Stock 1 0.4 -9.42 -1.07 2.92 3.56 2.47 0.13 6.02 -3.22 0.37 -7.43 1.38 0.85 2.21 7.07 Stock 2 -2.93 -9.61 -2.83 6.67 3.97 2.15 -5.27 4.06 4.9 -1.43 1.42 12.83 3.83 0.6 0.3 0.4 0.5 0.6 0.7 0.8 0.7 0.6 0.5 0.4 0.3 0.2 0.9 0.1 1 0 1.1 -0.1 4.62 1.2 -0.2 2 Collect data for Amazon and SP500 market returns over last 60 months. Draw a scatter diagram on excel, and fit a line that is best describe the relationship between Amazon and SP500 returns. What is the intercept and slope coefficients in the regression? Are they statistically significant? '1 Use the returns data below for two stocks, construct a mean-variance efficient frontier. (1) Calculate the covariances of two assets (2) For each of the following weights, compute the expected returns and standard deviation of the portfolios. (3) Plot them in a coordinate system with y-axis as expected return and x-axis as standard deviations. Returns of two assets Portfolio weights Stock 1 -0.2 Stock 2 1.2 1.1 -0.1 0 1 0.9 0.1 0.2 0.8 Stock 1 0.4 -9.42 -1.07 2.92 3.56 2.47 0.13 6.02 -3.22 0.37 -7.43 1.38 0.85 2.21 7.07 Stock 2 -2.93 -9.61 -2.83 6.67 3.97 2.15 -5.27 4.06 4.9 -1.43 1.42 12.83 3.83 0.6 0.3 0.4 0.5 0.6 0.7 0.8 0.7 0.6 0.5 0.4 0.3 0.2 0.9 0.1 1 0 1.1 -0.1 4.62 1.2 -0.2 2 Collect data for Amazon and SP500 market returns over last 60 months. Draw a scatter diagram on excel, and fit a line that is best describe the relationship between Amazon and SP500 returns. What is the intercept and slope coefficients in the regression? Are they statistically significant
Step by Step Solution
There are 3 Steps involved in it

Get step-by-step solutions from verified subject matter experts