

Question: 1. Use the rnorm function in R to generate n = 100 samples of X ~ N(3,0), o = 3 (for help use ?rnorm).
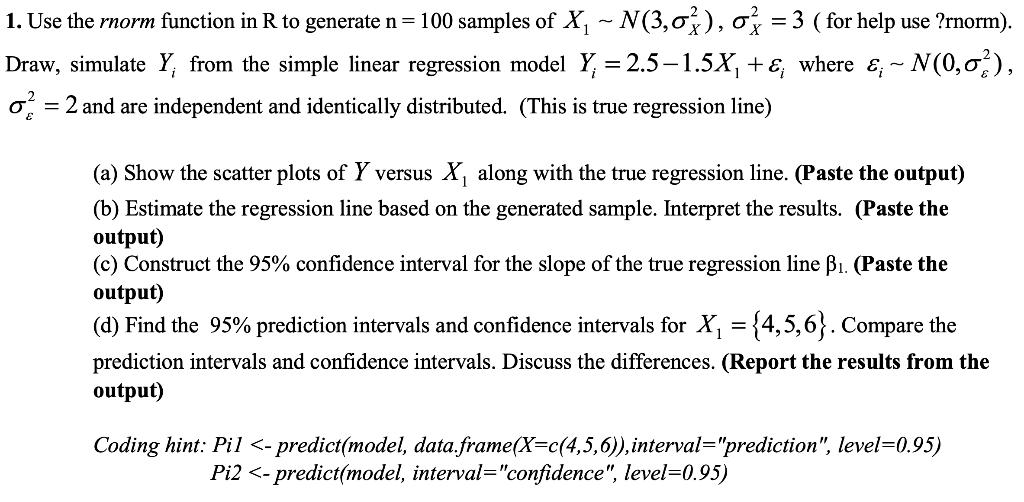
1. Use the rnorm function in R to generate n = 100 samples of X ~ N(3,0), o = 3 (for help use ?rnorm). Draw, simulate Y, from the simple linear regression model Y = 2.5-1.5X +&; where &; ~ - N(0,0), = 2 and are independent and identically distributed. (This is true regression line) (a) Show the scatter plots of Y versus X, along with the true regression line. (Paste the output) (b) Estimate the regression line based on the generated sample. Interpret the results. (Paste the output) (c) Construct the 95% confidence interval for the slope of the true regression line . (Paste the output) (d) Find the 95% prediction intervals and confidence intervals for X = {4,5,6}. Compare the prediction intervals and confidence intervals. Discuss the differences. (Report the results from the output) Coding hint: Pil
Step by Step Solution
3.36 Rating (149 Votes )
There are 3 Steps involved in it
To complete this task in R ... View full answer

Get step-by-step solutions from verified subject matter experts