

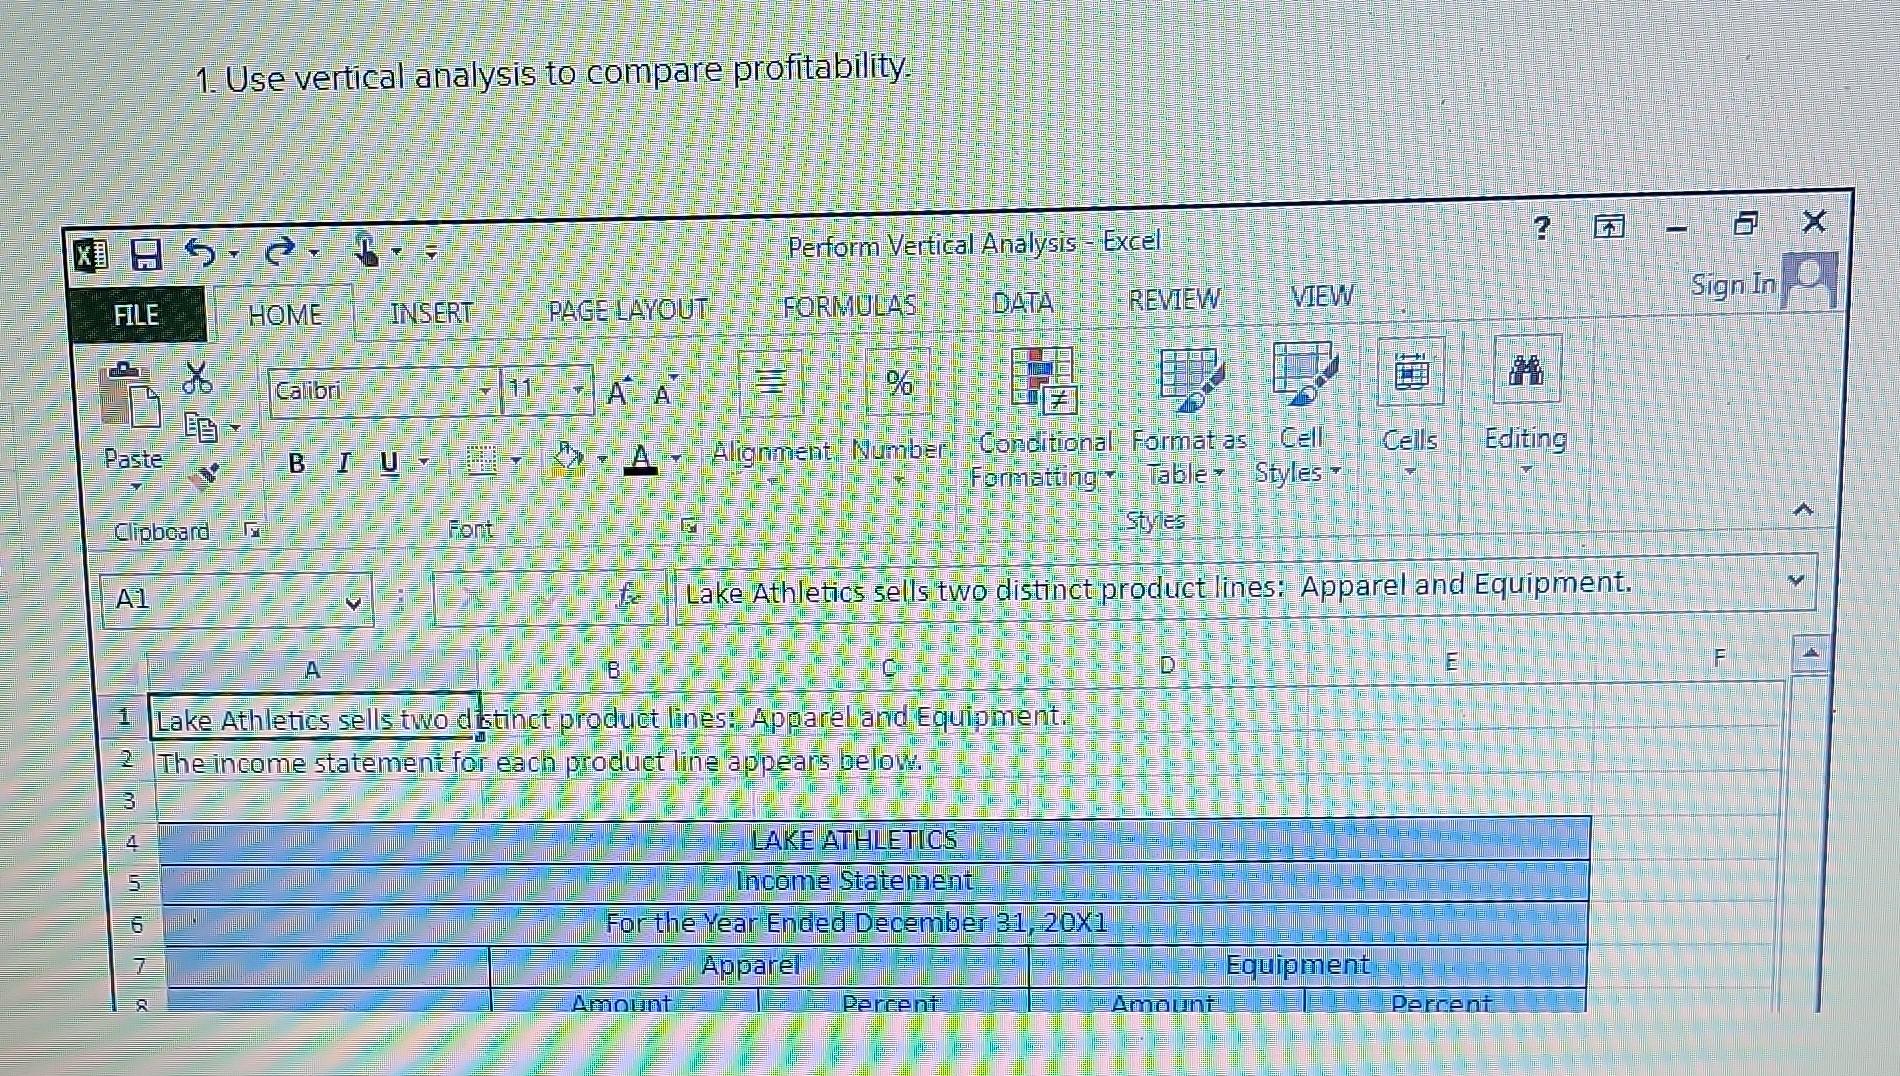
Question: 1. Use vertical analysis to compare profitability. 19 Required: 1. Use appropriate Excel formulas to perform vertical analysis and complete the Percent columns for both
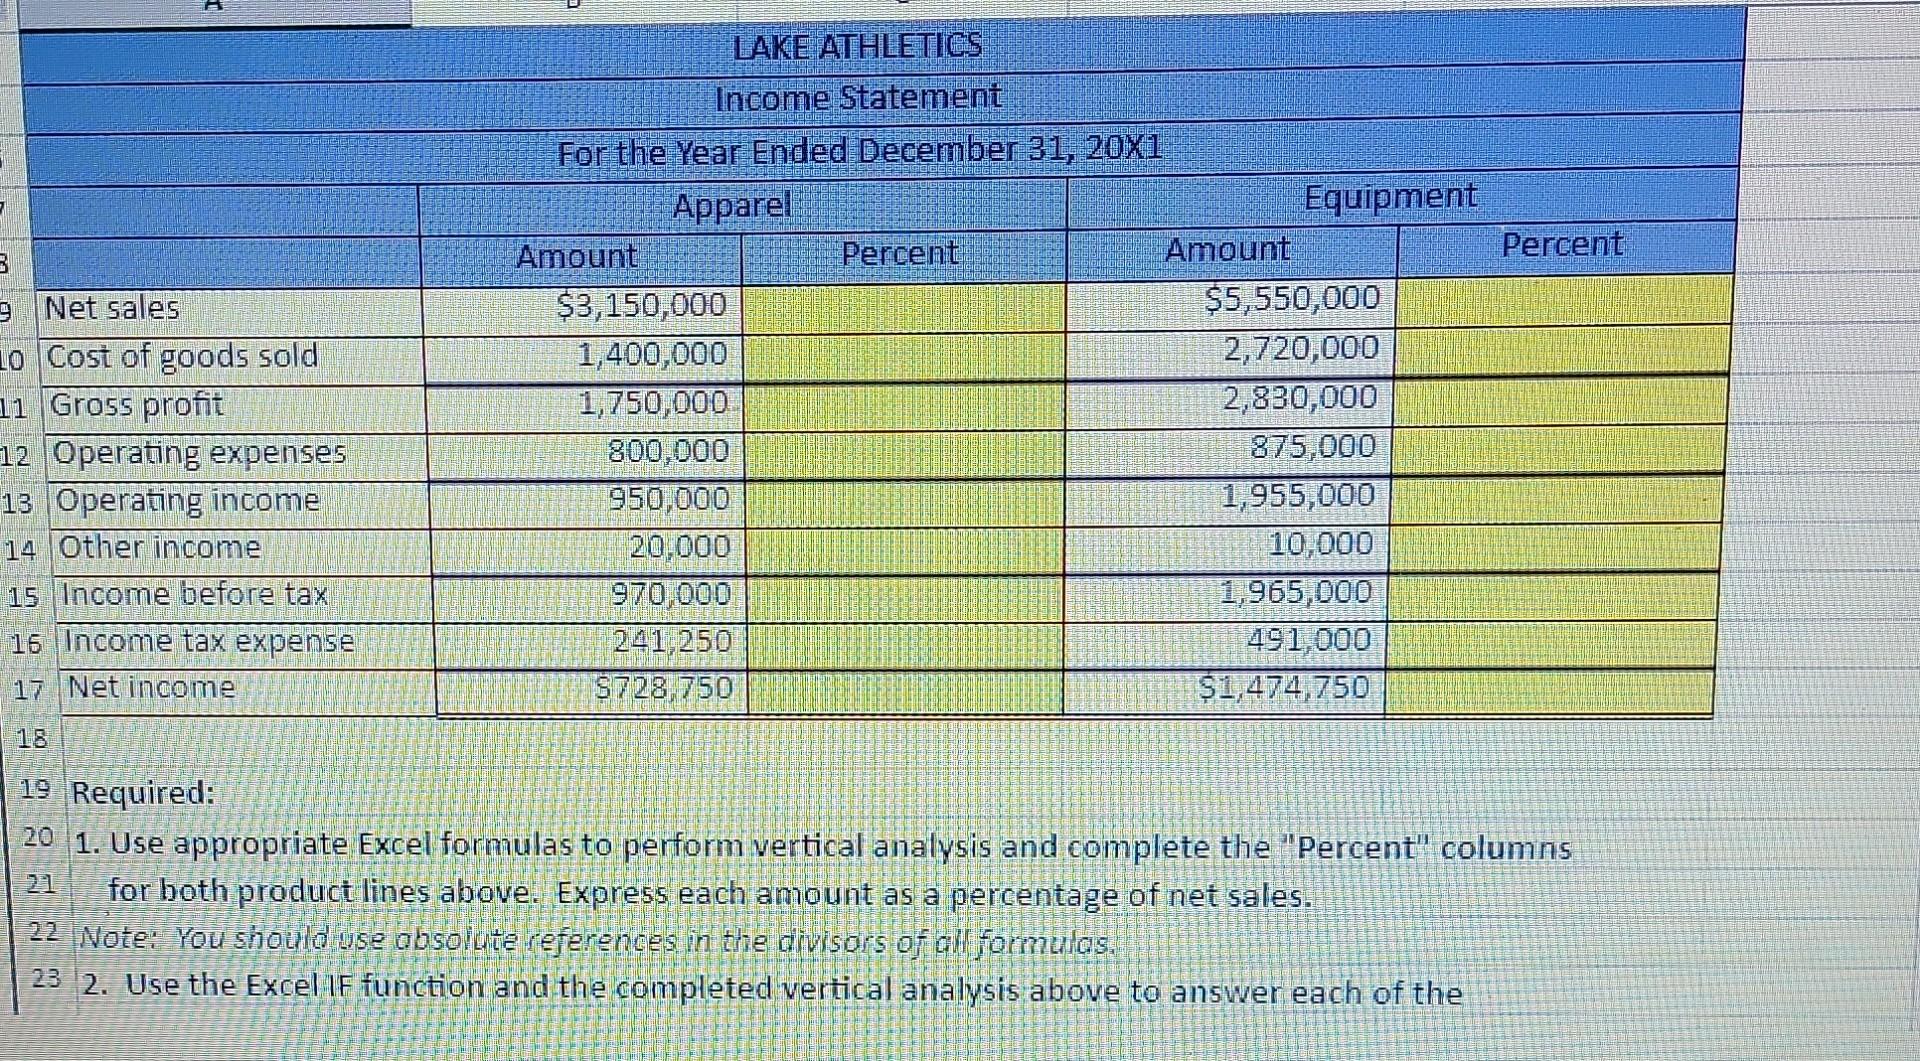
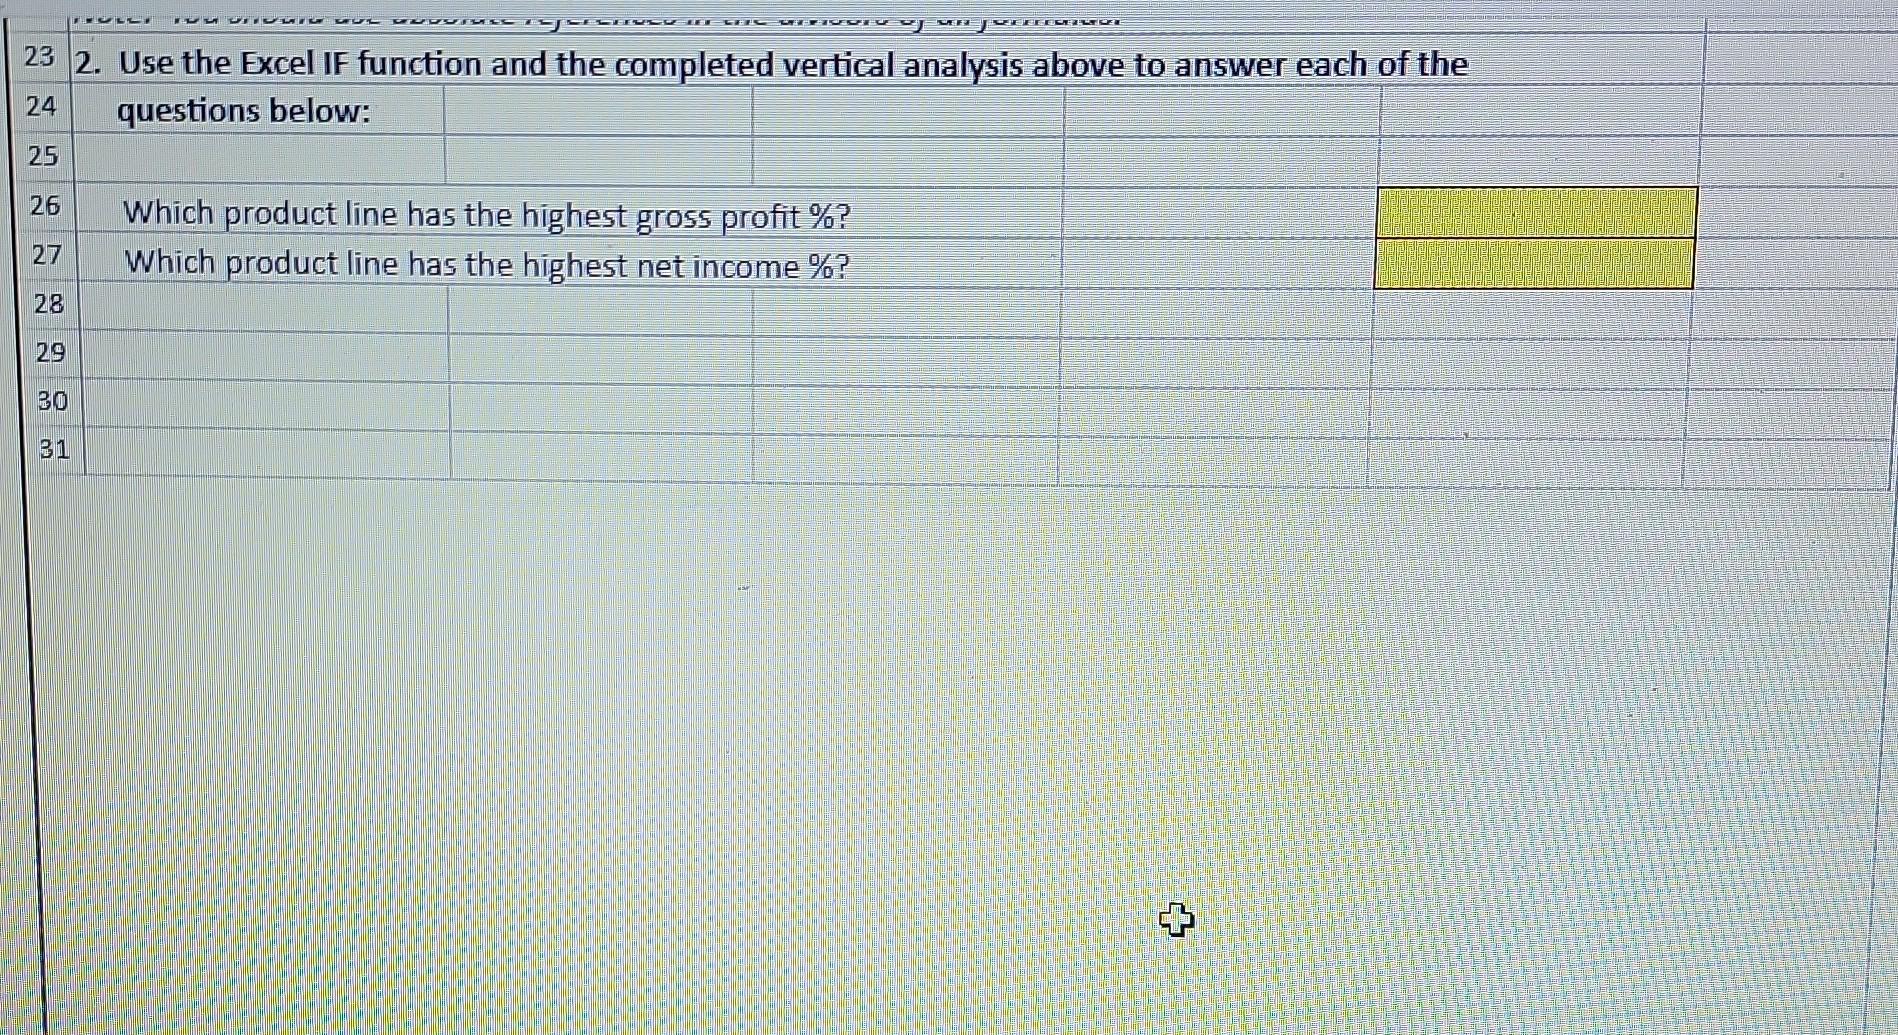
1. Use vertical analysis to compare profitability. 19 Required: 1. Use appropriate Excel formulas to perform vertical analysis and complete the "Percent" columns for both product lines above. Express each amount as a percentage of net sales. 22 Note: You should wse absoivte references in the divisors of all formulas. 23 2. Use the Excel IF function and the completed vertical analysis above to answer each of the \begin{tabular}{|l|l|l|} \hline 23 & 2. Use the Excel IF function and the completed vertical analysis above to answer each of the \\ \hline 24 & questions below: \\ \hline 25 & & Which product line has the highest gross profit % ? \\ \hline 27 & Which product line has the highest net income % ? \\ \hline 28 & \\ \hline 29 & \\ 30 & \\ 31 & \\ \hline \end{tabular}
Step by Step Solution
There are 3 Steps involved in it

Get step-by-step solutions from verified subject matter experts