

Question: 1) Using a sample size online resources, collect TWO of the following numerical variables average monthly house price in Toronto last year vs the number
1) Using a sample size online
resources, collect TWO of the following numerical variables average monthly house price in Toronto last year vs the number of sales per month. To get a sample of size of at least 30, collect the past three years.
12 months per year will get you a sample of 36 . in an organized manner using an appropriate sampling
technique of your choice; Provide all references for your research on the
summary page.
2) Create an introduction which will include the purpose and focus of your project as
well as reasons as to why you chose the topic at hand. Your introduction will
also introduce the main topic question as well as any relevant sub-questions to
help you research your main topic. Your introduction should conclude with a
hypothesis as to what the outcome of your research will be.
-> Participate in your first student-teacher conference by email to
discuss your progress; mandatory and cannot be missed.
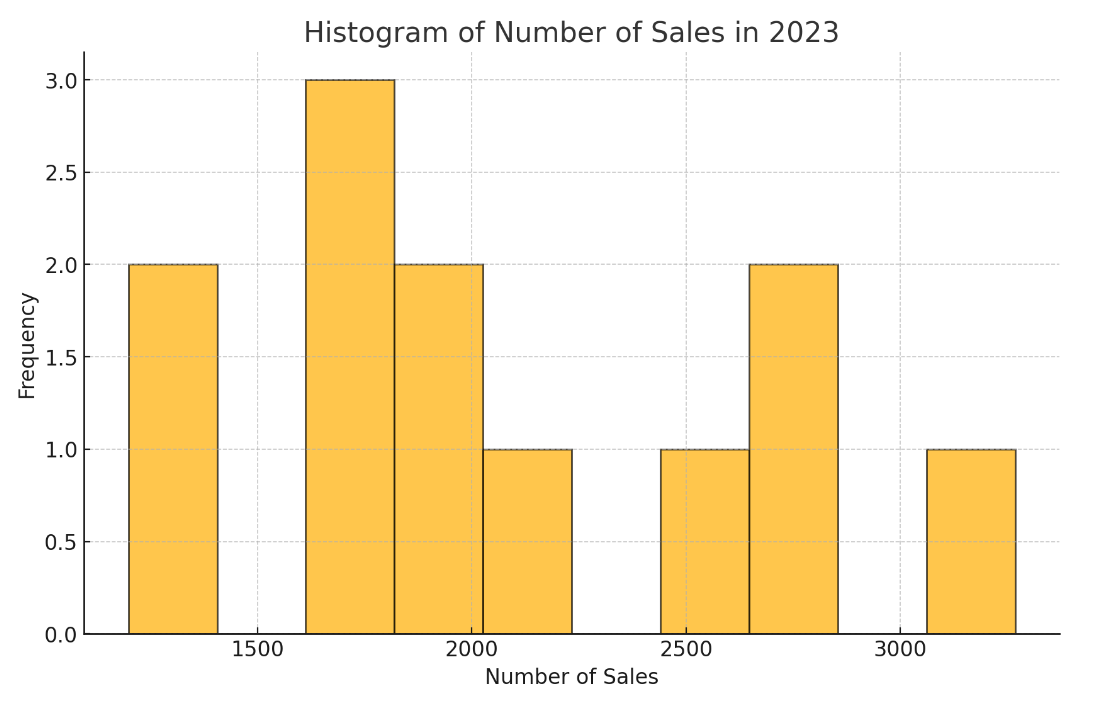
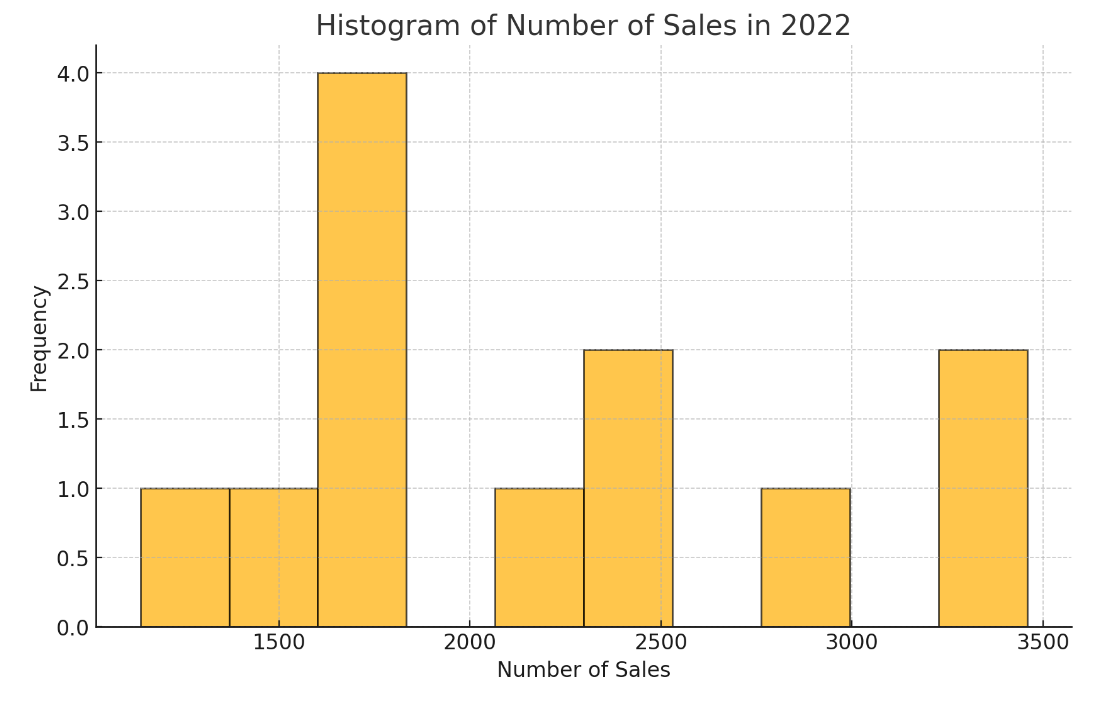
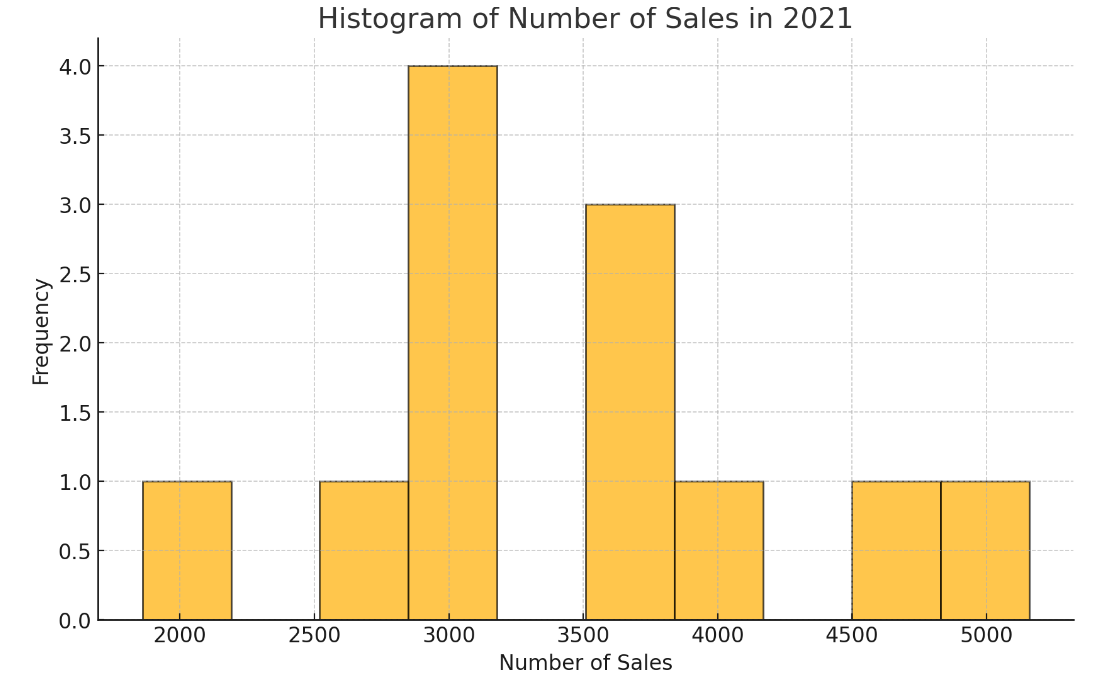
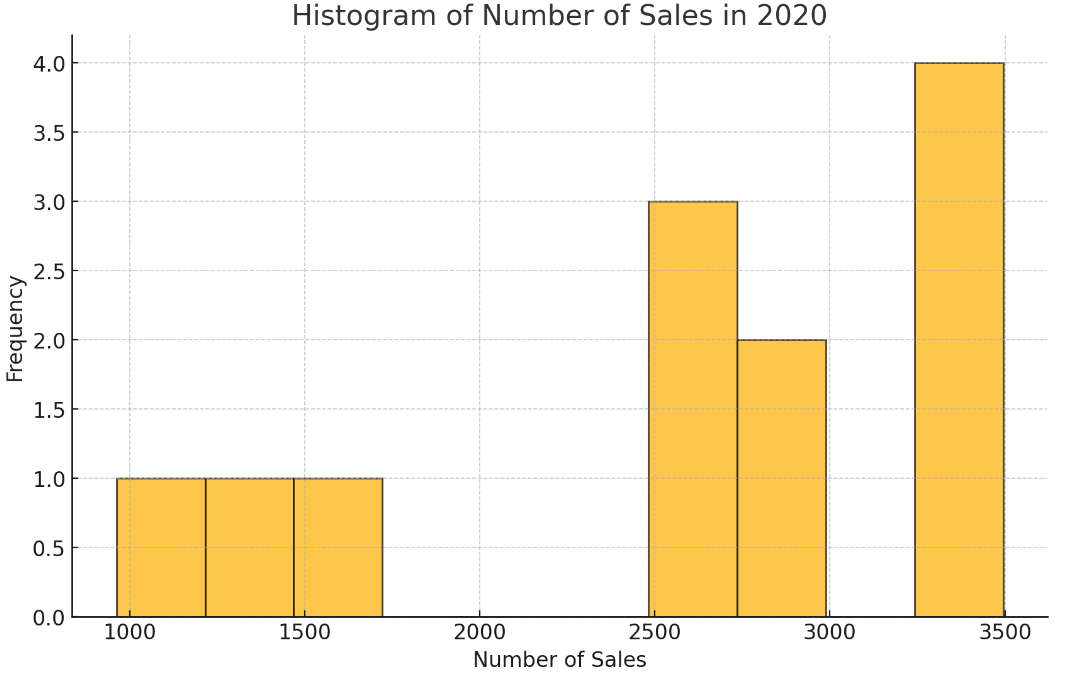
3) Apply one-variable statistical analysis of your data for EACH of the variables
using your knowledge and understanding of single variable statistics; including
organized frequency tables of your findings. USING MICROSOFT
APPLICATIONS (OR OTHER SIMILAR TECHNOLOGY SUCH AS DESMOS),
graph EACH of your variables using bar graphs (or histograms), frequency
polygons, and cumulative frequency polygons. For EACH variable, use
MR. EVGENI GILIOUTIN CPT MDM4U141
JUNE 2024, PAGE 5 OF 8
_____________________________________________________________________________________________
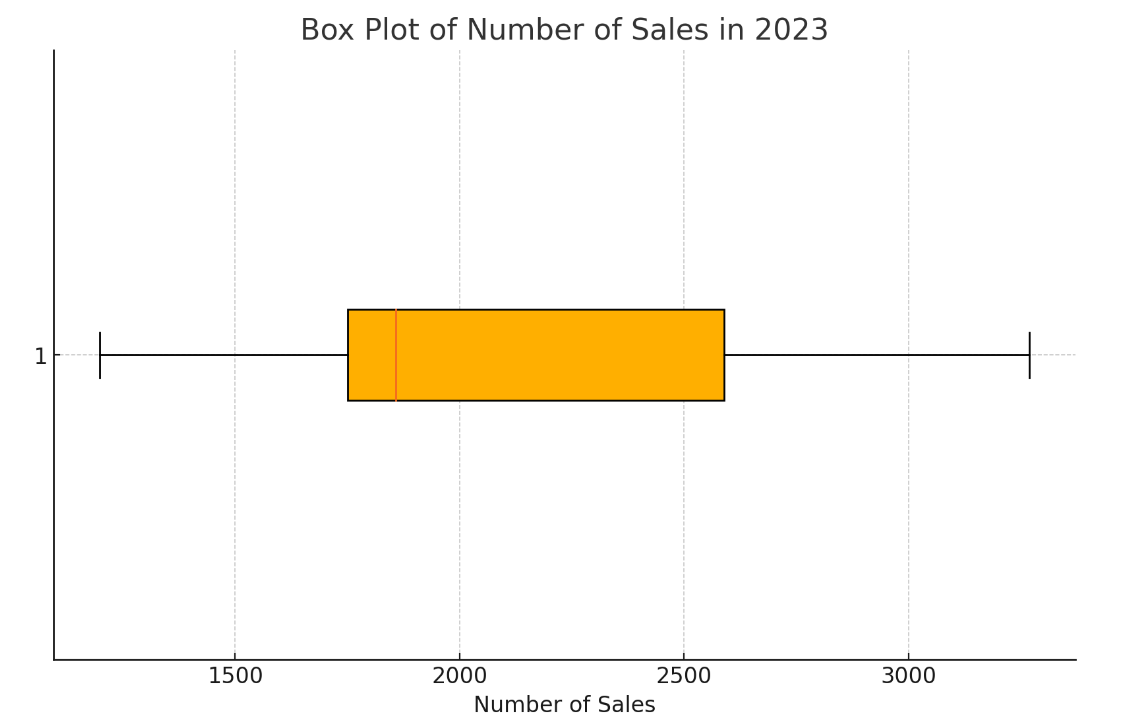
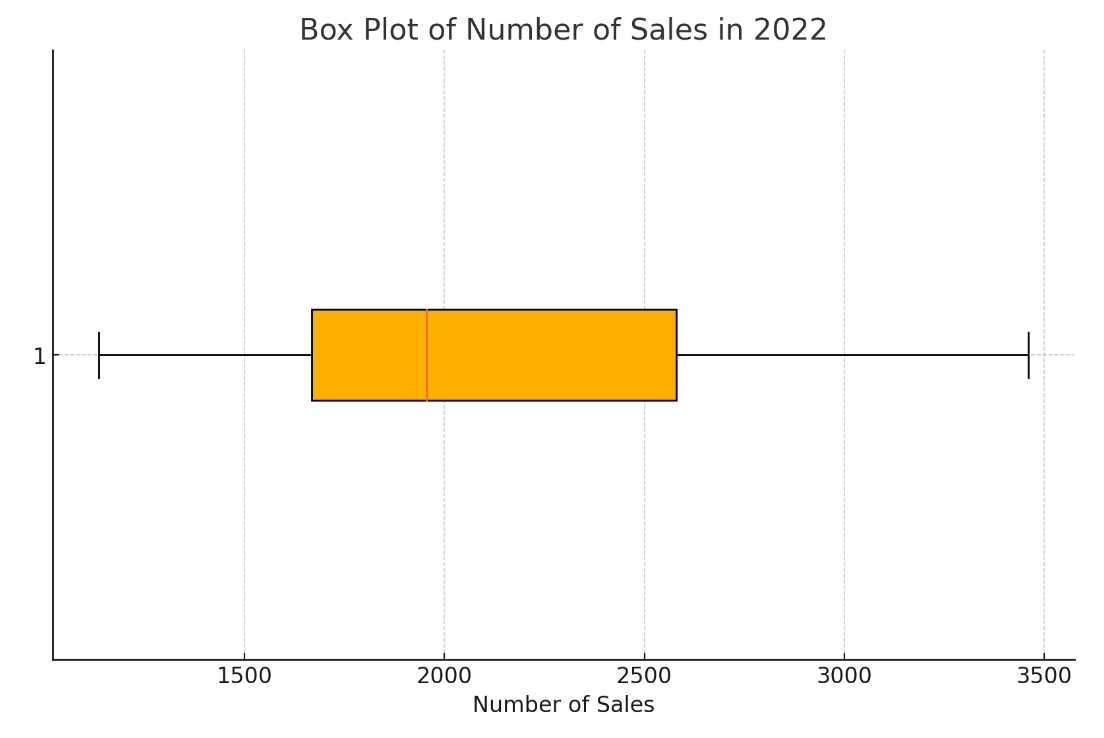
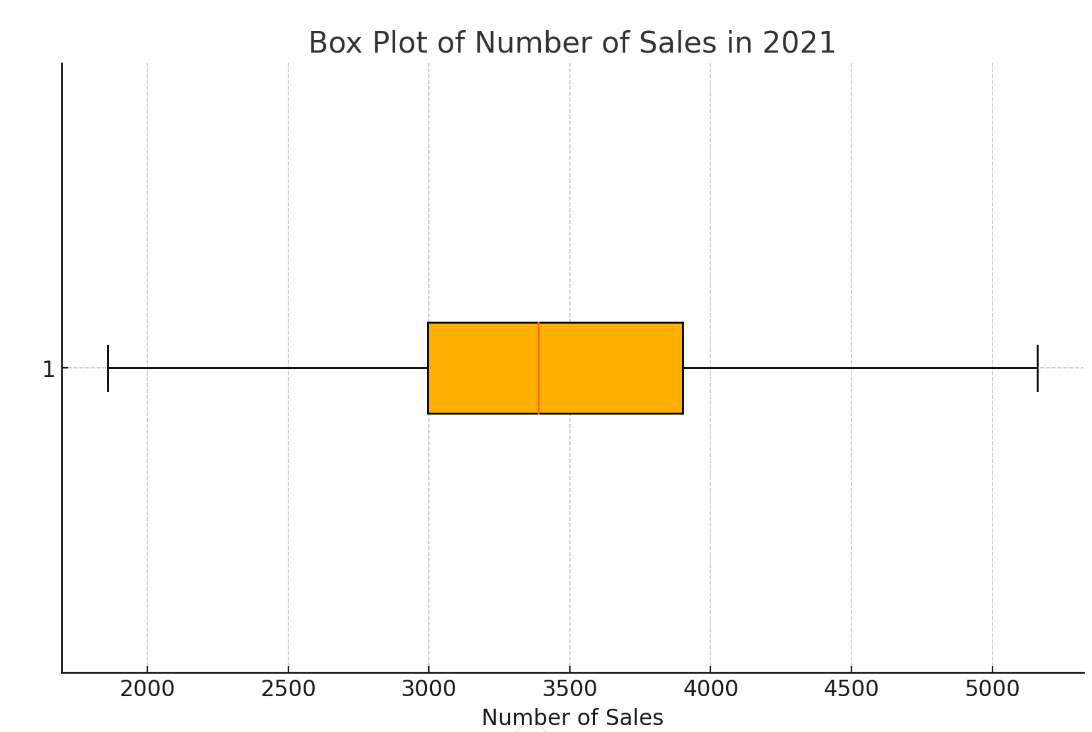
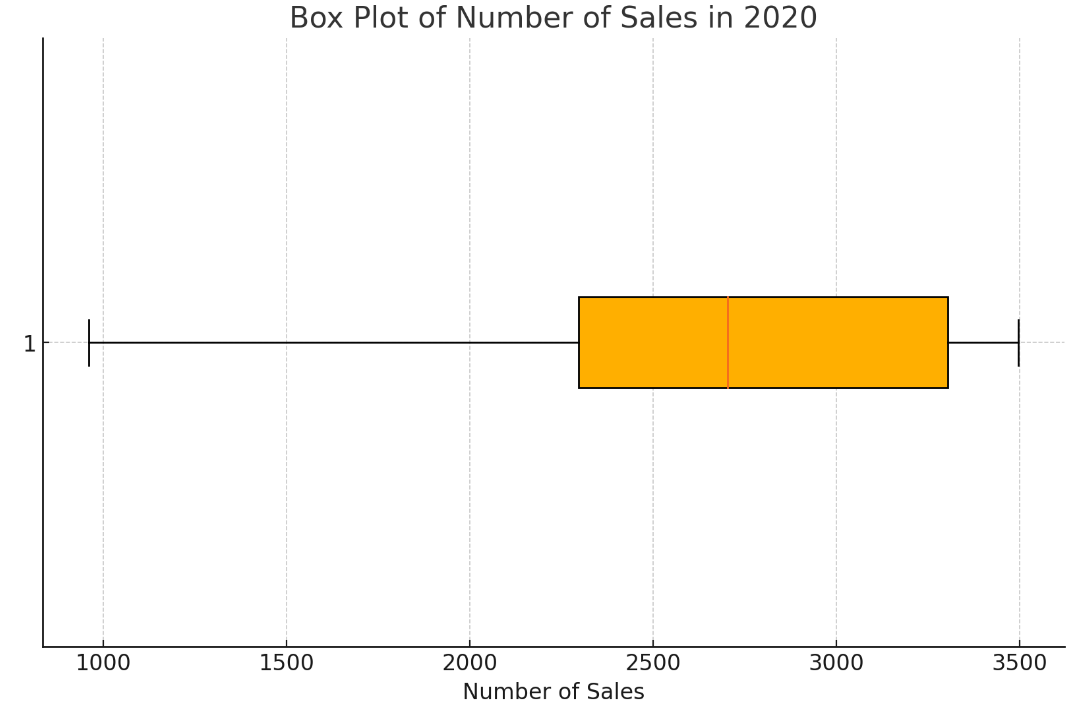
technology to calculate the sample mean, median, mode, and range. For EACH
variable, use technology to calculate the sample standard deviation and
variance. Create a five number summary and a modified box-and-whiskers plot
for EACH variable.
-> Participate in your second student-teacher conference by email to
discuss your progress; mandatory and cannot be missed.
4) Apply two-variable statistical analysis of your date for BOTH of the variable
using your knowledge and understanding of two variable statistics. Use
technology to make a scatter plot for BOTH of your variables. Use technology to
determine the correlation coefficient as well as the coefficient of determination for
your data. Apply AT LEAST THREE different regressions models for BOTH of
your variables and clearly display their equations and coefficients of
determinations.
-> Participate in your final student-teacher conference to discuss your
progress; mandatory and cannot be missed.
5) Organize, summarize, and discuss your findings from steps 1 to 4 above as well
as answer the following questions (you may go beyond these questions); THIS
WILL CREATE BOTH YOUR PRESENTATION & SUMMARY FOR YOUR CPT.
a) Which sampling technique(s) did you use for your data collection process in
step 1? Why did you decide to use this sampling technique(s)? Explain.
b) Did you encounter any type of bias during the collection process? If yes,
explain what type and how you minimized the bias. If no bias was
encountered, explain why not.
c) If you were to redo this project, would you use the same sampling?
technique(s) or a different technique(s)? Explain your reasoning.
d) Is linear or non-linear regression model most appropriate for you project?
Explain your choice based on your analysis from step 3.
e) What are the independent variable and the dependent variable in your project?
from step 3? How did you decide on this allocation of the variables?
f) What causal relationship(s), if any, exist between your variable. Defend your
answer using your knowledge from two variable statistics.
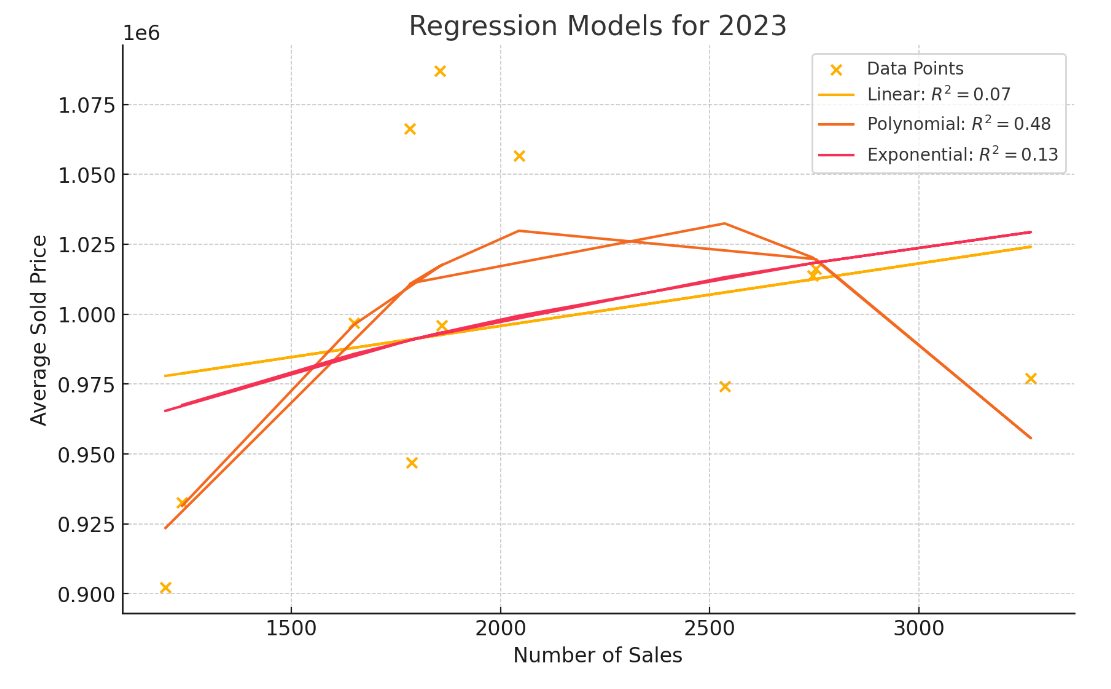
\f\f\f\f\f\f\f\f1e6 Regression Models for 2023 X % Data Points 1.075 Linear: R2 =0.07 ' Polynomial: R?=0.48 Exponential; R2=10,13 1.050 _g 1.025 | - a o o 1.000 N o 3 0.975
Step by Step Solution
There are 3 Steps involved in it

Get step-by-step solutions from verified subject matter experts