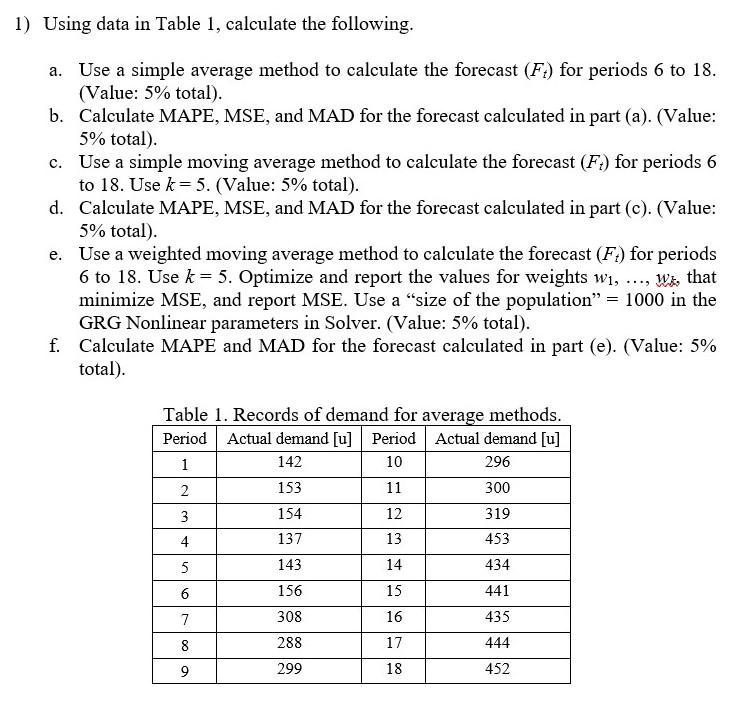
Question: 1) Using data in Table 1, calculate the following. a. Use a simple average method to calculate the forecast (Ft) for periods 6 to 18.

1) Using data in Table 1, calculate the

1) Using data in Table 1, calculate the following. a. Use a simple average method to calculate the forecast (Ft) for periods 6 to 18. (Value: 5% total). b. Calculate MAPE, MSE, and MAD for the forecast calculated in part (a). (Value: 5% total). c. Use a simple moving average method to calculate the forecast (Fr) for periods 6 to 18. Use k= 5. (Value: 5% total). d. Calculate MAPE, MSE, and MAD for the forecast calculated in part (c). (Value: 5% total). e. Use a weighted moving average method to calculate the forecast (Ft) for periods 6 to 18. Use k = 5. Optimize and report the values for weights W1, ..., W., that minimize MSE, and report MSE. Use a size of the population = 1000 in the GRG Nonlinear parameters in Solver. (Value: 5% total). f. Calculate MAPE and MAD for the forecast calculated in part (e). (Value: 5% total). Table 1. Records of demand for average methods. Period Actual demand [u] Period Actual demand [u] 1 142 10 296 2 153 11 300 3 154 12 319 4 137 13 453 5 143 14 434 6 156 15 441 7 308 16 435 8 288 17 444 9 299 18 452 8

Step by Step Solution

There are 3 Steps involved in it

1 Expert Approved Answer
Step: 1 Unlock blur-text-image
Question Has Been Solved by an Expert!

Get step-by-step solutions from verified subject matter experts

Step: 2 Unlock
Step: 3 Unlock

Students Have Also Explored These Related General Management Questions!