

Question: 1. Using data plot openness versus Industrial Pay Inequality (from UTIP-UNIDO) for the nation. IT'S UP TO YOU TO FIGURE OUT HOW TO DO THIS.

1. Using data plot openness versus Industrial Pay Inequality (from UTIP-UNIDO) for the nation. IT'S UP TO YOU TO FIGURE OUT HOW TO DO THIS. I've done this with two-period respectively:
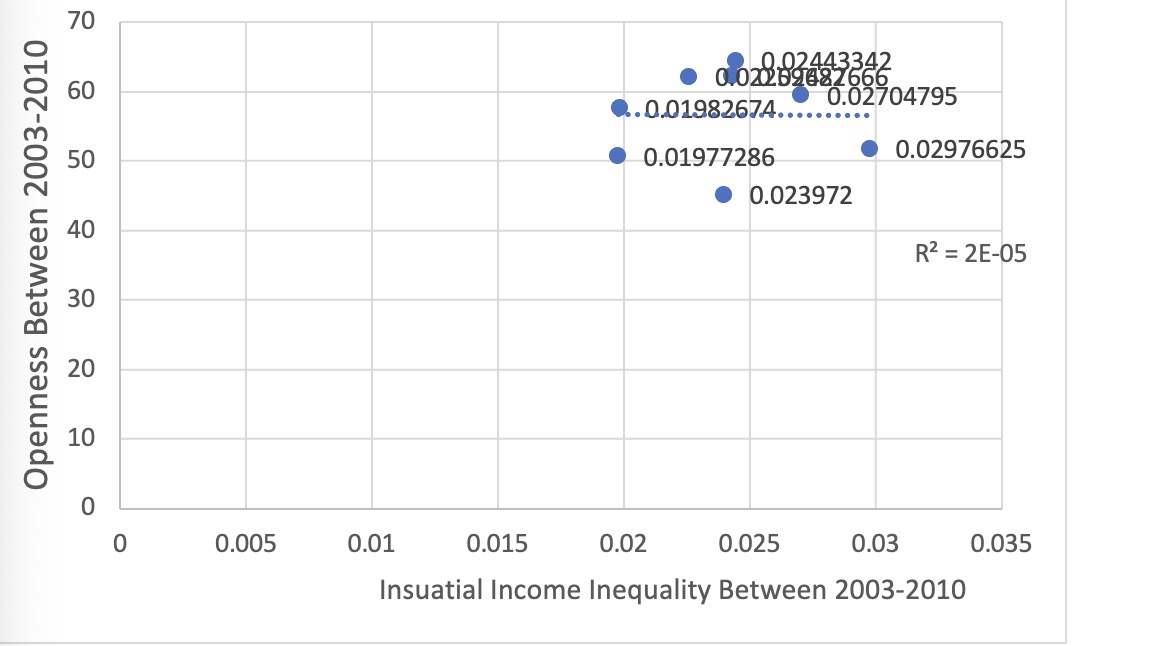
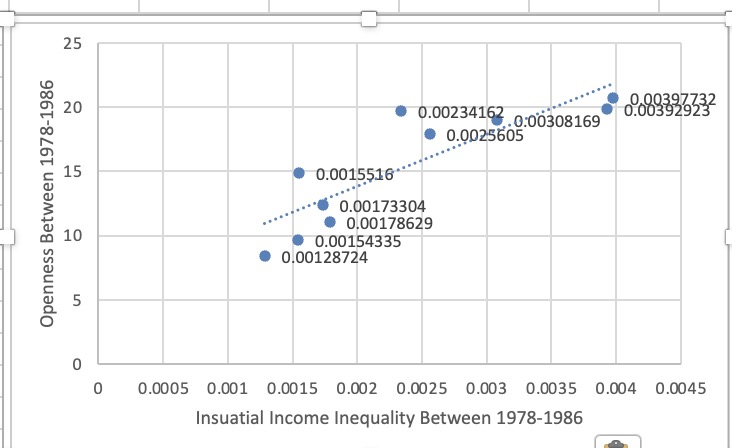
70 60 . 0 02209682666 Q..0.01982674.......... 0.02704795 50 0.01977286 0.02976625 0.023972 40 R2 = 2E-05 Openness Between 2003-2010 30 20 10 0 0 0.005 0.01 0.015 0.02 0.025 0.03 0.035 Insuatial Income Inequality Between 2003-201025 20 0.00397 732 0.00234162 . 0:00308169 0.00392923 0.0025605 15 0.0015516 Openness Between 1978-1986 0.00173304 0.00178629 10 0.00154335 0.00128724 un 0 0 0.0005 0.001 0.0015 0.002 0.0025 0.003 0.0035 0.004 0.0045 Insuatial Income Inequality Between 1978-1986
Step by Step Solution
There are 3 Steps involved in it

Get step-by-step solutions from verified subject matter experts