

Question: 1. Using Excel and the table data above please create : i. A Key Performance Index table based on 100% total score for each individual.
1. Using Excel and the table data above please create :
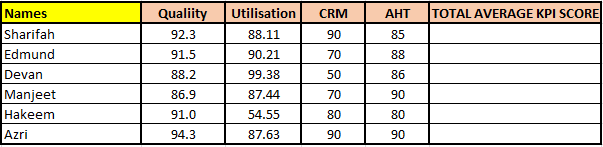
i. A Key Performance Index table based on 100% total score for each individual. The percentage should be divided equally among all elements and do insert a table of variance in each element.
ii. A Bar chart of Total Average KPI Score
iii. A Bar chart of Variance of Total Average KPI Score (50 marks)
2. Using Power Point, create a presentation :
i. A Bar slide of Average Handling Time ( AHT )
ii. Insert comparison reasons from your top and lowest performer based on your floor management experience ( logical assumptions are allowed )
iii. A slide with your Action Plans indicated for the lowest Performer (30 Marks)
3. Using Word, use all required information based on your experience you think is mandatory to create a Minutes of Meeting template as the information tips provided below. You can use assumptions to fill in agendas to create a project. Be as creative as possible :
I. Project Name , Date , Time & Location
II. Introduction , People and Training
III. CRM System
IV. Infra & Technology (20 Marks)
Step by Step Solution
There are 3 Steps involved in it

Get step-by-step solutions from verified subject matter experts