Question: 1. Using Google Trends, compare 2 or more competing products or brands. a. An acceptable comparison requires more than one time range and more than
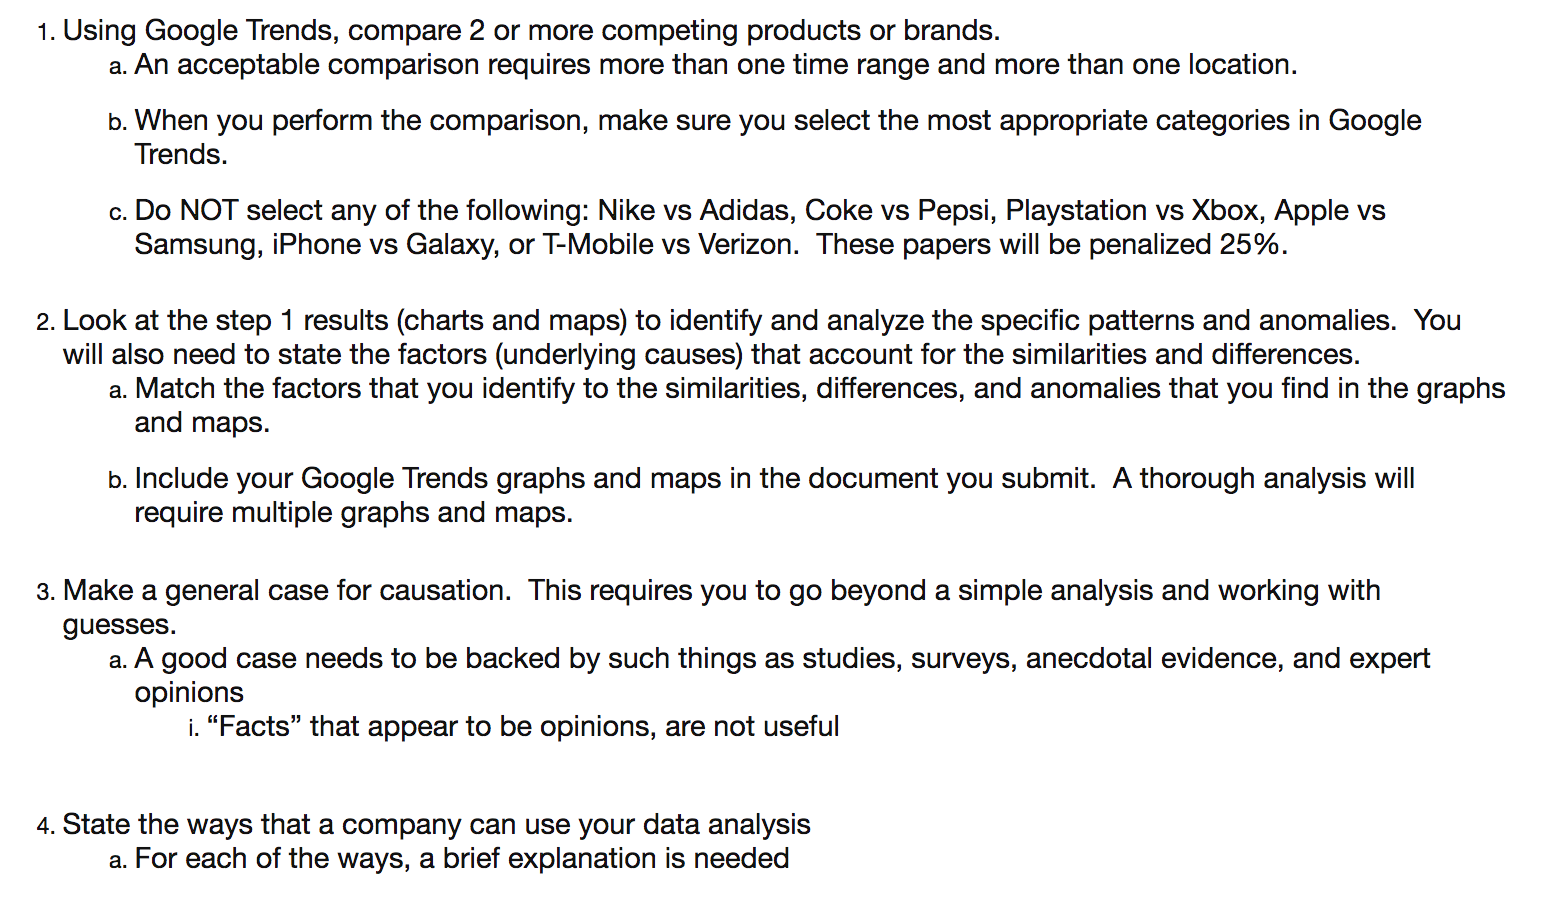
1. Using Google Trends, compare 2 or more competing products or brands. a. An acceptable comparison requires more than one time range and more than one location. b. When you perform the comparison, make sure you select the most appropriate categories in Google Trends. c. Do NOT select any of the following: Nike vs Adidas, Coke vs Pepsi, Playstation vs Xbox, Apple vs Samsung, iPhone vs Galaxy, or T-Mobile vs Verizon. These papers will be penalized 25%. 2. Look at the step 1 results (charts and maps) to identify and analyze the specific patterns and anomalies. You will also need to state the factors (underlying causes) that account for the similarities and differences. a. Match the factors that you identify to the similarities, differences, and anomalies that you find in the graphs and maps. b. Include your Google Trends graphs and maps in the document you submit. A thorough analysis will require multiple graphs and maps. 3. Make a general case for causation. This requires you to go beyond a simple analysis and working with guesses. a. A good case needs to be backed by such things as studies, surveys, anecdotal evidence, and expert opinions i. "Facts that appear to be opinions, are not useful 4. State the ways that a company can use your data analysis a. For each of the ways, a brief explanation is needed 1. Using Google Trends, compare 2 or more competing products or brands. a. An acceptable comparison requires more than one time range and more than one location. b. When you perform the comparison, make sure you select the most appropriate categories in Google Trends. c. Do NOT select any of the following: Nike vs Adidas, Coke vs Pepsi, Playstation vs Xbox, Apple vs Samsung, iPhone vs Galaxy, or T-Mobile vs Verizon. These papers will be penalized 25%. 2. Look at the step 1 results (charts and maps) to identify and analyze the specific patterns and anomalies. You will also need to state the factors (underlying causes) that account for the similarities and differences. a. Match the factors that you identify to the similarities, differences, and anomalies that you find in the graphs and maps. b. Include your Google Trends graphs and maps in the document you submit. A thorough analysis will require multiple graphs and maps. 3. Make a general case for causation. This requires you to go beyond a simple analysis and working with guesses. a. A good case needs to be backed by such things as studies, surveys, anecdotal evidence, and expert opinions i. "Facts that appear to be opinions, are not useful 4. State the ways that a company can use your data analysis a. For each of the ways, a brief explanation is needed


