

Question: 1. Using historical data, you find the following information about J&J and Ford, E(r) Ford 18.8% 31% 13.2% You compute a correlation coefficient of .19
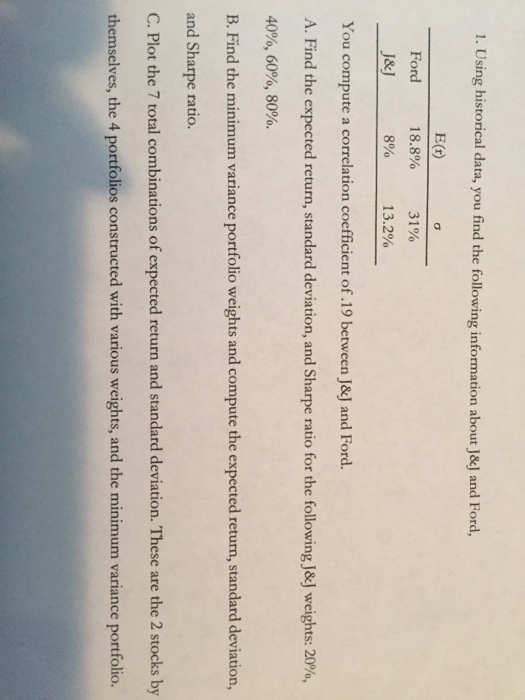
1. Using historical data, you find the following information about J&J and Ford, E(r) Ford 18.8% 31% 13.2% You compute a correlation coefficient of .19 between J&J and Ford. A. Find the expected return, standard deviation, and Sharpe ratio for the following & weights: 20%, 40%, 60%, 80%. B. Find the minimum variance portfolio weights and compute the expected return, standard deviation, and Sharpe ratio. C. Plot the 7 total combinations of expected return and standard deviation. These are the 2 stocks by themselves, the 4 portfolios constructed with various weights, and the minimum variance portfolio
Step by Step Solution
There are 3 Steps involved in it
1 Expert Approved Answer
Step: 1 Unlock

Question Has Been Solved by an Expert!
Get step-by-step solutions from verified subject matter experts
Step: 2 Unlock
Step: 3 Unlock