

Question: 1. using multiple regression, for each additional Production Batch, how much does our Manufacturing Overhead Increase? 2.using multiple regression, for each unit produced, how much
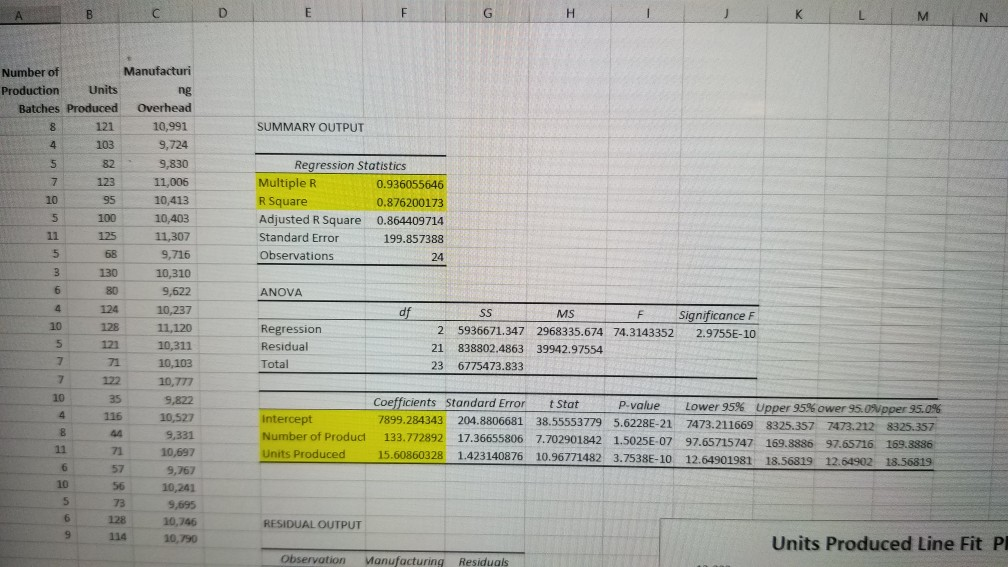
1. using multiple regression, for each additional Production Batch, how much does our Manufacturing Overhead Increase?
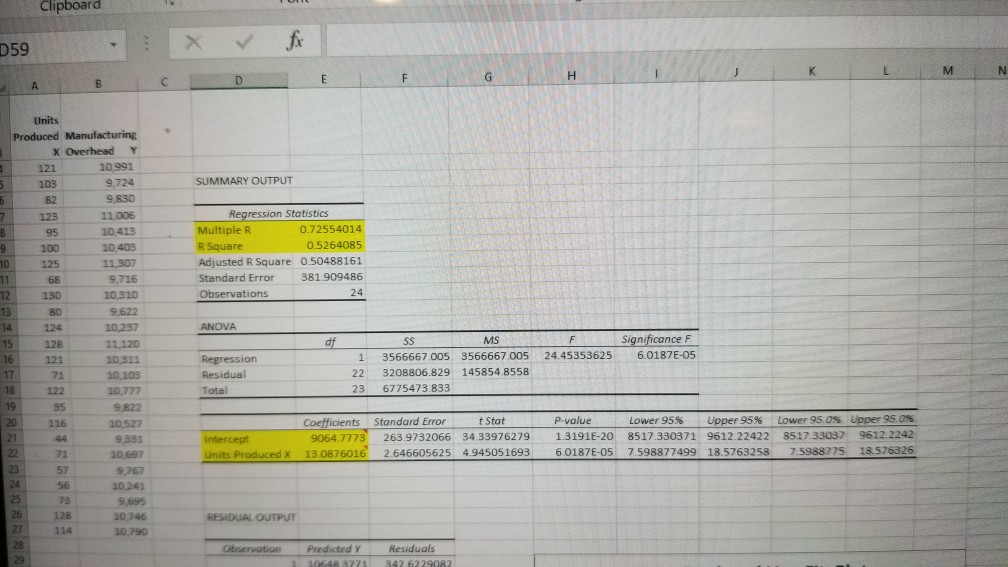
2.using multiple regression, for each unit produced, how much does our Manufacturing Overhead increase
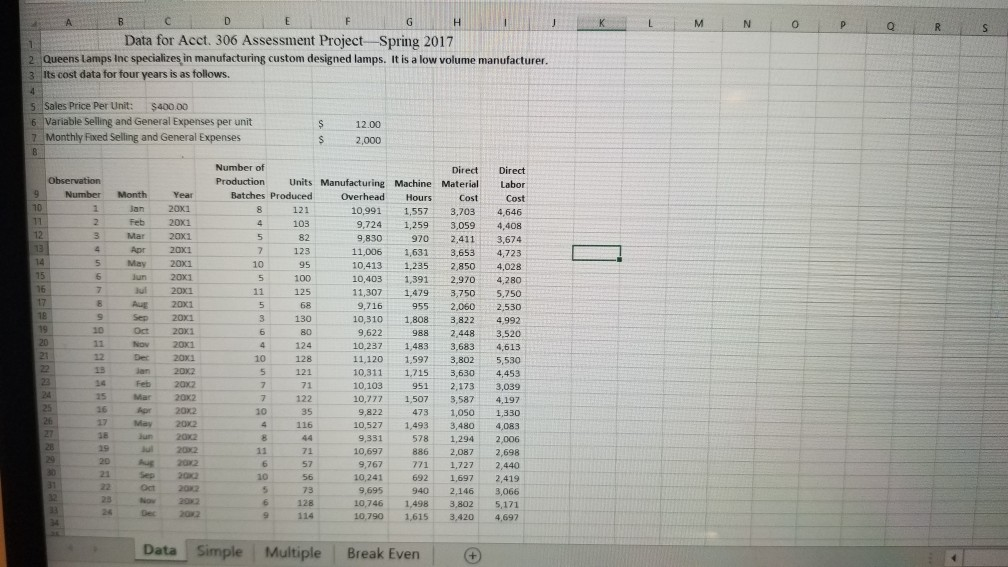
Data for Acct. 306 Assessment Project Spring 2017 Queens Lamps Inc specializes in manufacturing custom designed lamps. It is a low volume manufacturer Its cost data for four years is as follows. Sales Price Per Unit: $400.00 6 Variable Selling and General Expenses per unit s 12.00 $2,000 Monthly Fixed Selling and General Expenses Number of Direct Direct Production Units Manufacturing Machine Material Labr Number Month YearBatches Produced Overhead Hours CostCost Jan 20x1 121 4 103 82 123 10 95 5 100 10,991 1,5573,703 4,646 9.724 1,259 3,0594,408 9,830970 2,411 3,674 11,006 1,631 3,653 4,723 10,413 1,2352,8504,028 10,403 1,391 2,970 4,280 11,307 1,479 3,750 5,750 9,716 955 2,060 2,530 10,3101,8083,822 4,992 9,622 988 2,448 3,520 10,2371,483 3,6834,613 11,120 1,5973,802 5,530 10,311 1,7153,6304,453 10,103 951 2,173 3,039 10,777 1,507 3,587 4,197 9,822 473 1,050 1,330 10,527 1,493 3,480 4,083 9,331 578 1,294 2,006 10,697886 2,087 2,698 9,767771 1,727 2,440 10,241 692 1,697 2,419 9,695 940 2,146 3,066 10,746 1,498 3,802 5,171 10,790 1,615 3,420 4,697 Feb 20x1 Mar 20x1 Apr 20x1 May 20X1 Jun 20x1 Ju 20x1 BAug 20x1 Sep 20x1 10 Oct 20X1 Nov 20x1 Dec 20x1 125 130 80 4 124 10 128 121 71 Feb 20x2 15 Mar 20x2 16 Apr 20X2 May 20x2 38 Jun 2x2 lu 20x2 35 71 21 Sep Oct 2ox2 Dec 202 56 73 6 128 202 Data Simple Multiple Break Even |G Clipboard D59 8 Units Produced Manufacturing x Overhead Y 121 10991 103 9,724 SUMMARY OUTPUT 9830 Regression Statistics 10,413 10 403 Multiple R R Square Adjusted R Square 0.50488161 Standard Error 381.909486 Observations 0.72554014 0.5264085 9,716 24 9,622 ANOVA 11.120 FSignificance F 1 3566667.005 3566667005 24.45353625 6.0187E-05 22 3208806.829 145854.8558 23 6775473.833 2 8 2 0,103 Residual Total 9 822 116 Coefficients Standard Errar P-value t Stat Lower 95% Upper 95% Lower 95.0% Upper 95 0% 9064 7773 263.9732066 34.33976279 1.3191E-20 8517.330371 9612.22422 8517 33037 9612 2242 Units Produced X 13.0876016 2.646605625 4.945051693 6.0187E-05 7.598877499 18 5763258 7 5988775 18.576326 9391 8 2 9367 10,241 9 695 10,746 RESIDUAL OUTPUT 114 Residual:s Manufacturi Number of Production Units Batches Produced Overhead 8 12110,991 9,724 5 82 9,830 12311,006 SUMMARY OUTPUT 4 103 Regression Statistics Multiple R 0.936055646 0.876200173 0.864409714 199.857388 24 ,-- 95 5 100 10,413RSquare 10,403 11,307 68 9,716 130 10,310 9,622 Adjusted R Square Standard Error Observations ANOVA 4 124 10,237 10 128 11,120 10,311 71 10,103 122 10,777 10 35 9,822 4 116 10,527 44 9,331 11 71 10,697 df Significance F 2 5936671.347 2968335.674 74.3143352 2.9755E-10 MS Regressiorn Residual Total 21 838802.4863 39942.97554 23 6775473.833 Coefficients Standard Errort Stat p-value Lower 95% Upper 95% ower 950Npper 95.0% 7899.284343 204.8806681 38.55553779 5.6228E-21 7473.211669 8325.357 7473.212 8325.357 Number of Product 133.772892 17.36655806 7.702901842 1.5025E-07 97.65715747 169.8886 97.65716 169.3836 3.7538E-10 12.64901981 18.56819 12.64902 18.56819 ercept Units Produced 15.60860328 1.423140876 10.96771482 6 579,767 56 10,241 73 9,695 6 12810,746 9 114 10,790 RESIDUAL OUTPUT Units Produced Line Fit P Observation Manufacturing Residuals
Step by Step Solution
There are 3 Steps involved in it

Get step-by-step solutions from verified subject matter experts