

Question: 1) Using Table 1 in the case duplicate the sensitivity analysis of the production points for the three options considered in the case by management:
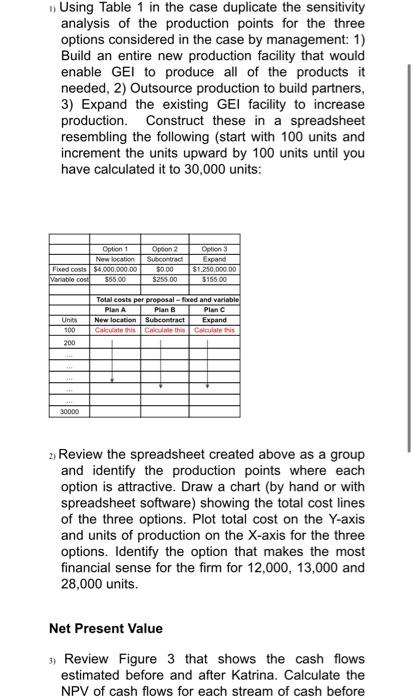
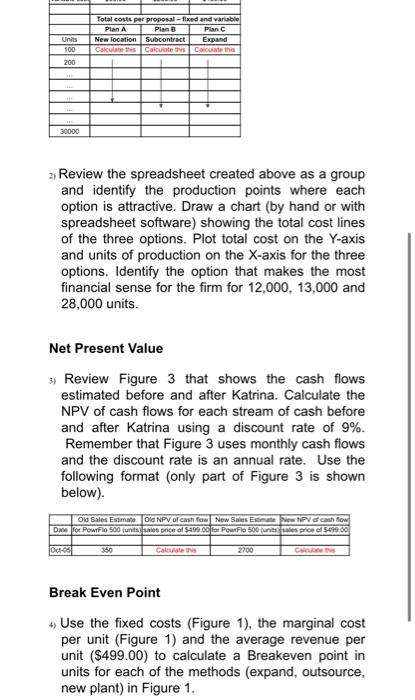
1) Using Table 1 in the case duplicate the sensitivity analysis of the production points for the three options considered in the case by management: 1) Build an entire new production facility that would enable GEI to produce all of the products it needed, 2) Outsource production to build partners, 3) Expand the existing GEI facility to increase production. Construct these in a spreadsheet resembling the following (start with 100 units and increment the units upward by 100 units until you have calculated it to 30,000 units: 2) Review the spreadsheet created above as a group and identify the production points where each option is attractive. Draw a chart (by hand or with spreadsheet software) showing the total cost lines of the three options. Plot total cost on the Y-axis and units of production on the X-axis for the three options. Identify the option that makes the most financial sense for the firm for 12,000,13,000 and 28,000 units. Net Present Value 3) Review Figure 3 that shows the cash flows estimated before and after Katrina. Calculate the NPV of cash flows for each stream of cash before 2) Review the spreadsheet created above as a group and identify the production points where each option is attractive. Draw a chart (by hand or with spreadsheet software) showing the total cost lines of the three options. Plot total cost on the Y-axis and units of production on the X-axis for the three options. Identify the option that makes the most financial sense for the firm for 12,000,13,000 and 28,000 units. Net Present Value 3) Review Figure 3 that shows the cash flows estimated before and after Katrina. Calculate the NPV of cash flows for each stream of cash before and after Katrina using a discount rate of 9%. Remember that Figure 3 uses monthly cash flows and the discount rate is an annual rate. Use the following format (only part of Figure 3 is shown below). Break Even Point 4) Use the fixed costs (Figure 1), the marginal cost per unit (Figure 1) and the average revenue per unit ($499.00) to calculate a Breakeven point in units for each of the methods (expand, outsource, new plant) in Figure 1. 1) Using Table 1 in the case duplicate the sensitivity analysis of the production points for the three options considered in the case by management: 1) Build an entire new production facility that would enable GEI to produce all of the products it needed, 2) Outsource production to build partners, 3) Expand the existing GEI facility to increase production. Construct these in a spreadsheet resembling the following (start with 100 units and increment the units upward by 100 units until you have calculated it to 30,000 units: 2) Review the spreadsheet created above as a group and identify the production points where each option is attractive. Draw a chart (by hand or with spreadsheet software) showing the total cost lines of the three options. Plot total cost on the Y-axis and units of production on the X-axis for the three options. Identify the option that makes the most financial sense for the firm for 12,000,13,000 and 28,000 units. Net Present Value 3) Review Figure 3 that shows the cash flows estimated before and after Katrina. Calculate the NPV of cash flows for each stream of cash before 2) Review the spreadsheet created above as a group and identify the production points where each option is attractive. Draw a chart (by hand or with spreadsheet software) showing the total cost lines of the three options. Plot total cost on the Y-axis and units of production on the X-axis for the three options. Identify the option that makes the most financial sense for the firm for 12,000,13,000 and 28,000 units. Net Present Value 3) Review Figure 3 that shows the cash flows estimated before and after Katrina. Calculate the NPV of cash flows for each stream of cash before and after Katrina using a discount rate of 9%. Remember that Figure 3 uses monthly cash flows and the discount rate is an annual rate. Use the following format (only part of Figure 3 is shown below). Break Even Point 4) Use the fixed costs (Figure 1), the marginal cost per unit (Figure 1) and the average revenue per unit ($499.00) to calculate a Breakeven point in units for each of the methods (expand, outsource, new plant) in Figure 1
Step by Step Solution
There are 3 Steps involved in it

Get step-by-step solutions from verified subject matter experts