

Question: 1. Using the AUCAT data, compute for descriptive statistics and graphs of the two distributions. 2. Print out the output and answer the following:
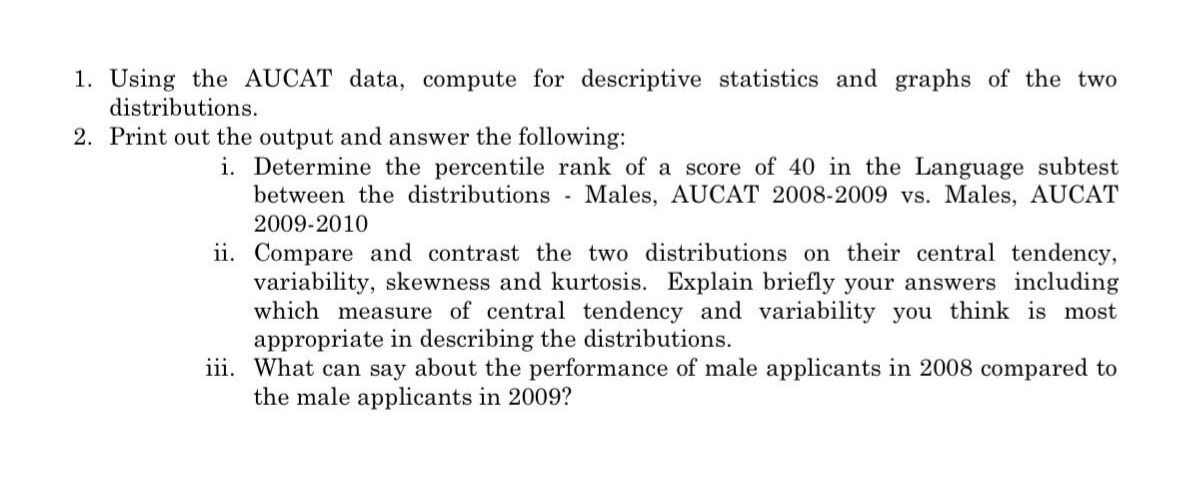
1. Using the AUCAT data, compute for descriptive statistics and graphs of the two distributions. 2. Print out the output and answer the following: i. Determine the percentile rank of a score of 40 in the Language subtest between the distributions Males, AUCAT 2008-2009 vs. Males, AUCAT 2009-2010 ii. Compare and contrast the two distributions on their central tendency, variability, skewness and kurtosis. Explain briefly your answers including which measure of central tendency and variability you think is most appropriate in describing the distributions. iii. What can say about the performance of male applicants in 2008 compared to the male applicants in 2009?
Step by Step Solution
There are 3 Steps involved in it

Get step-by-step solutions from verified subject matter experts