

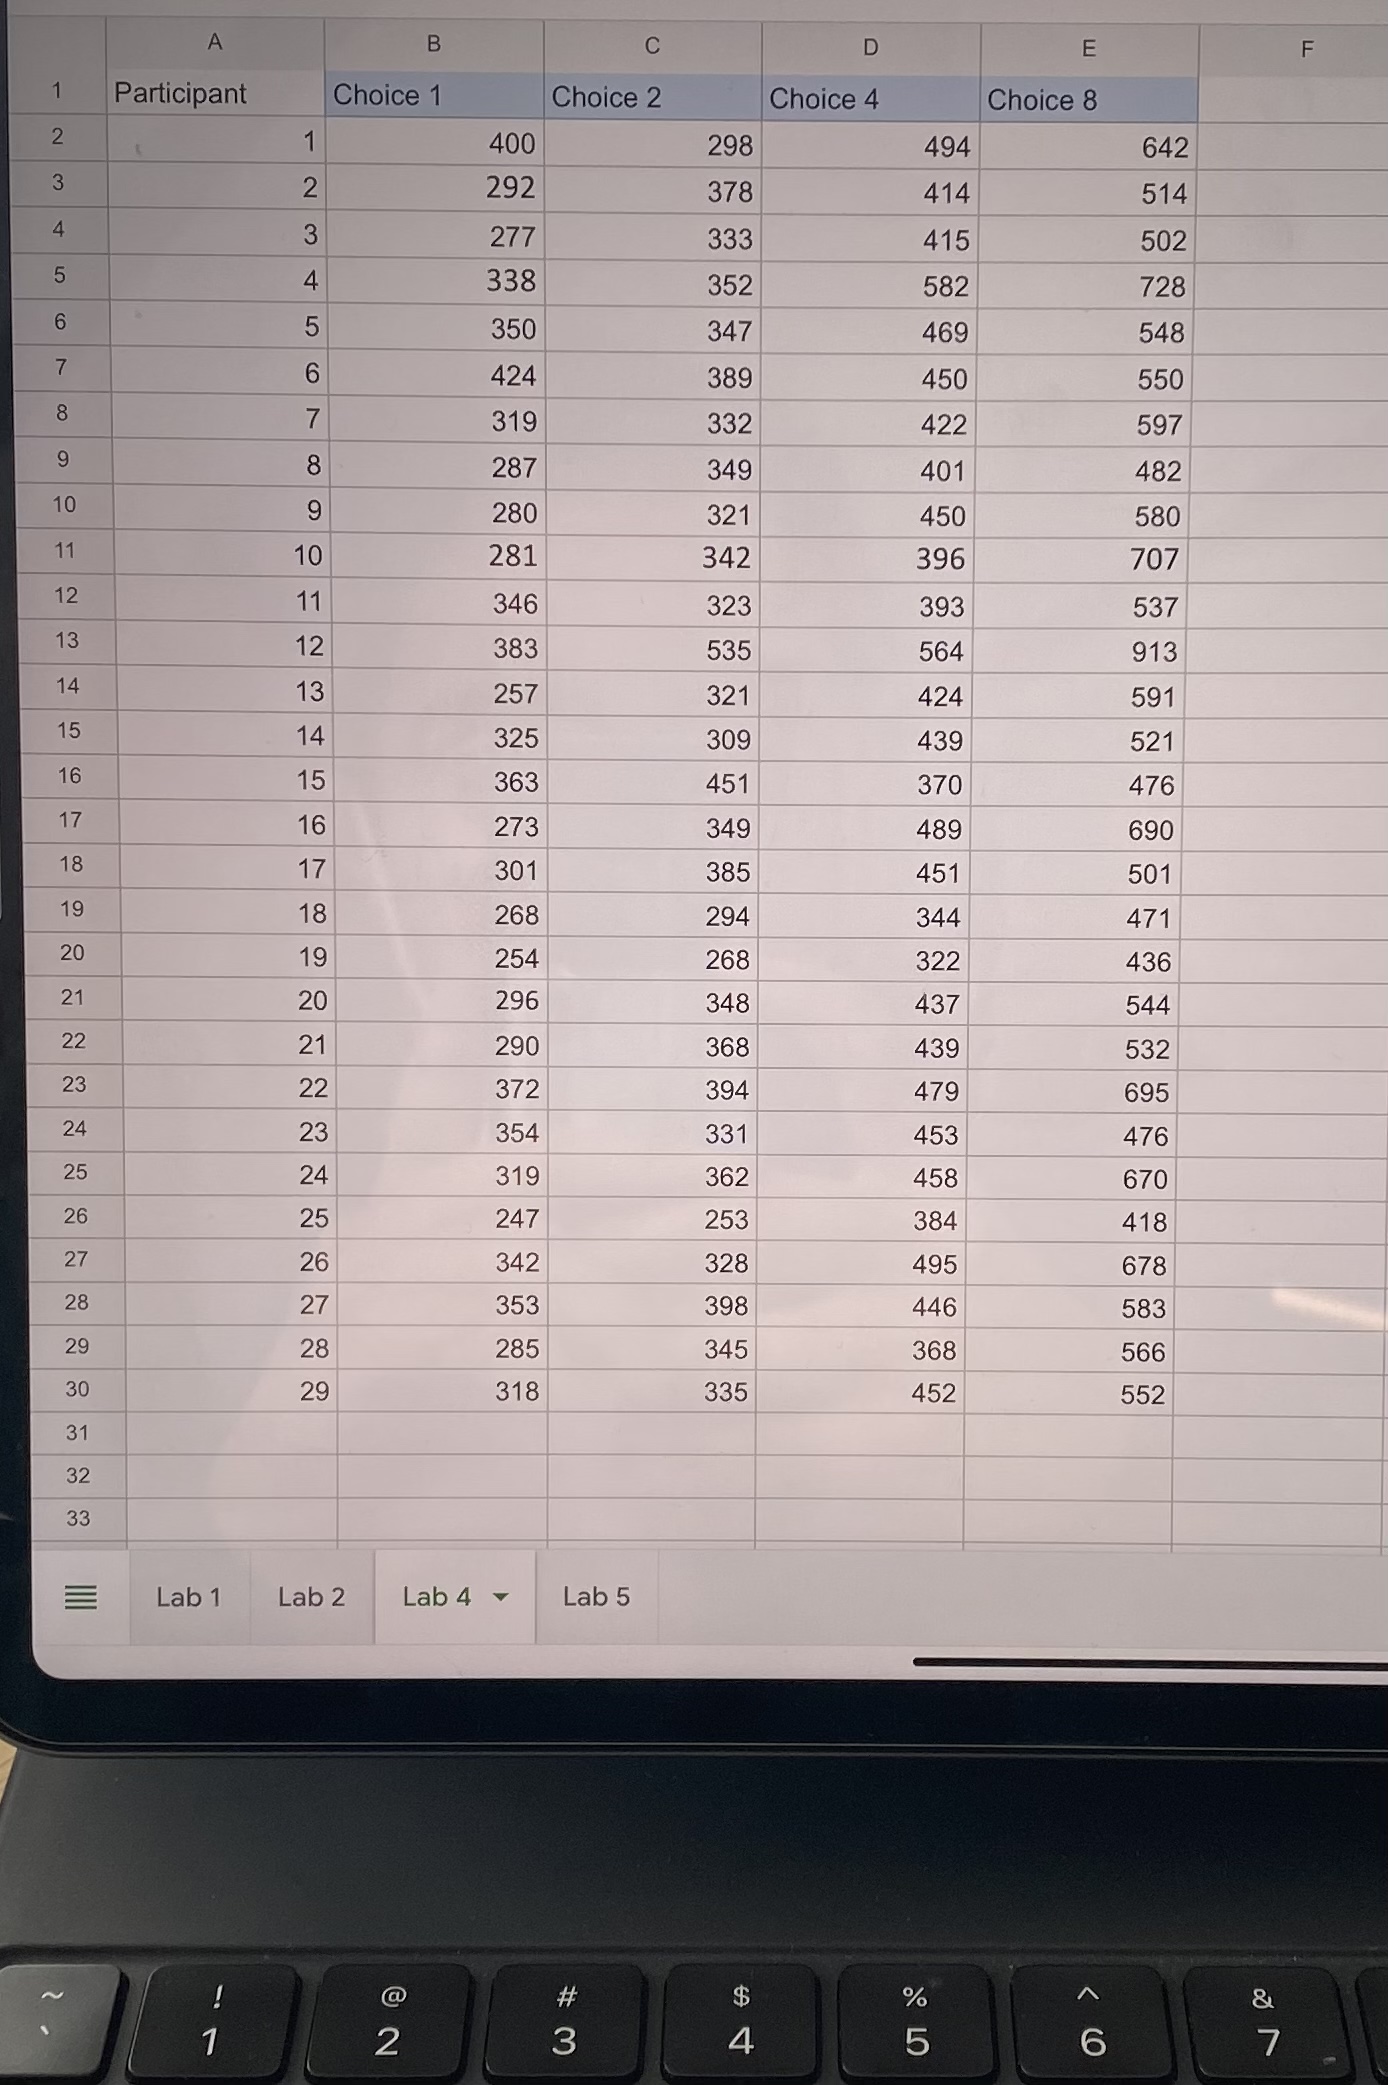
Question: 1. Using the average, simple RT score [1 choice] and the 8 choice RT score for each student: a) Using Excel, calculate the correlation coefficient
![1. Using the average, simple RT score [1 choice] and the](https://s3.amazonaws.com/si.experts.images/answers/2024/06/6676a362f1fdb_1066676a362ce984.jpg)
1. Using the average, simple RT score [1 choice] and the 8 choice RT score for each student:
a) Using Excel, calculate the correlation coefficient (1 mark) b) Using Excel, determine the regression function for the data (The 8 choices RT should be the dependent variable (Y) and simple RT is the independent variable (X). Provide output table as well. marks, 1 mark for table, 1 mark for correct equation).
c) Create a scatterplot showing the relationship between these two variables, including a regression line (called a linear trend line in Excel). The 8 choice RT should be the dependent variable F(Y) and simple RT is the independent variable (X). Fully label for full marks (2 marks, include axis labels, regression line). See
Step by Step Solution
There are 3 Steps involved in it

Get step-by-step solutions from verified subject matter experts