

Question: 1.) Using the data below, please prepare a balance sheet for 2015 and 2016, an income statement for years 2015 and 2016 (including earnings per
1.) Using the data below, please prepare a balance sheet for 2015 and 2016, an income statement for years 2015 and 2016 (including earnings per share data, and a statement of retained earnings for 2016.
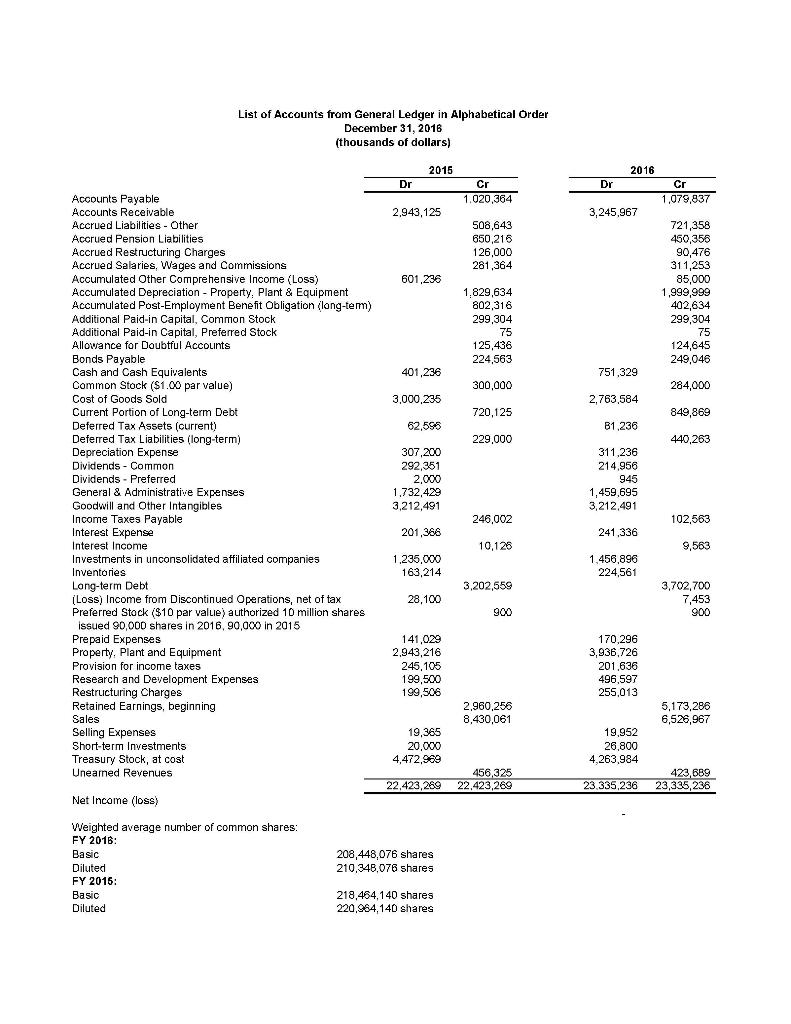
List of Accounts from General Ledger in Alphabetical Order December 31, 2016 (thousands of dollars) 2015 2016 Dr Dr Cr 1.020,364 Cr 1,079,837 2,943,125 3,245,967 508,643 650,216 126,000 281,364 601.236 1.829,634 802,316 299,304 75 125,436 224,563 721,358 450,356 90,476 311,253 85,000 1.999,999 402,634 299,304 75 124,645 249,046 401,236 751,329 300,000 284,000 3,000,235 2,763,584 720,125 849,869 62,596 B1,236 229,000 440,263 Accounts Payable Accounts Receivable Accrued Liabilities - Other Accrued Pension Liabilities Accrued Restructuring Charges Accrued Salaries, Wages and Commissions Accumulated Other Comprehensive Income (Loss) Accumulated Depreciation - Property. Plant & Equipment Accumulated Post-Employment Benefit Obligation (long-tem) Additional Paid-in Capital, Common Stock Additional Paid-in Capital, Preferred Stock Allowance for Doubtful Accounts Bonds Payable Cash and Cash Equivalents Common Stock ($1.00 par value) Cost of Goods Sold Current Portion of Long-term Debt Deferred Tax Assets (current) Deferred Tax Liabilities (long-term) Depreciation Expense Dividends - Common Dividends - Preferred General & Administrative Expenses Goodwill and Other Intangibles Income Taxes Payable Interest Expense Interest Income Investments in unconsolidated affiliated companies Inventories Long-term Debt (Loss) Income from Discontinued Operations, net of tax Preferred Stock ($10 par value) authorized 10 million shares issued 90,000 shares in 2016, 90,000 in 2015 Prepaid Expenses Property, Plant and Equipment Provision for income taxes Research and Development Expenses Restructuring Charges Retained Earnings, beginning Sales Selling Expenses Short-term Investments Treasury Stock, at coat Unearned Revenues 307,200 292,351 2.000 1.732,429 3,212,491 311,236 214,956 945 1,459,695 3,212,491 246,002 102,563 201,366 241,336 10,126 9,563 1.235,000 163,214 1.456.896 224,561 3.202.559 28,100 3,702,700 7,453 900 141,029 2,943,216 245,105 199,500 199,506 170,296 3,936,726 201,636 496,597 255,013 2,960,256 8,430,061 5,173,286 6,526,967 19,365 20.000 4,472,969 19.952 26,800 4,263,984 22,423,269 456,325 22.423,269 23.335,236 423,689 23,336,236 Net Income (oss) Weighted average number of common shares: FY 2018: Basic Diluted FY 2015: Basic Diluted 208,448,076 shares 210,348,076 shares 218,464,140 shares 220,964,140 shares List of Accounts from General Ledger in Alphabetical Order December 31, 2016 (thousands of dollars) 2015 2016 Dr Dr Cr 1.020,364 Cr 1,079,837 2,943,125 3,245,967 508,643 650,216 126,000 281,364 601.236 1.829,634 802,316 299,304 75 125,436 224,563 721,358 450,356 90,476 311,253 85,000 1.999,999 402,634 299,304 75 124,645 249,046 401,236 751,329 300,000 284,000 3,000,235 2,763,584 720,125 849,869 62,596 B1,236 229,000 440,263 Accounts Payable Accounts Receivable Accrued Liabilities - Other Accrued Pension Liabilities Accrued Restructuring Charges Accrued Salaries, Wages and Commissions Accumulated Other Comprehensive Income (Loss) Accumulated Depreciation - Property. Plant & Equipment Accumulated Post-Employment Benefit Obligation (long-tem) Additional Paid-in Capital, Common Stock Additional Paid-in Capital, Preferred Stock Allowance for Doubtful Accounts Bonds Payable Cash and Cash Equivalents Common Stock ($1.00 par value) Cost of Goods Sold Current Portion of Long-term Debt Deferred Tax Assets (current) Deferred Tax Liabilities (long-term) Depreciation Expense Dividends - Common Dividends - Preferred General & Administrative Expenses Goodwill and Other Intangibles Income Taxes Payable Interest Expense Interest Income Investments in unconsolidated affiliated companies Inventories Long-term Debt (Loss) Income from Discontinued Operations, net of tax Preferred Stock ($10 par value) authorized 10 million shares issued 90,000 shares in 2016, 90,000 in 2015 Prepaid Expenses Property, Plant and Equipment Provision for income taxes Research and Development Expenses Restructuring Charges Retained Earnings, beginning Sales Selling Expenses Short-term Investments Treasury Stock, at coat Unearned Revenues 307,200 292,351 2.000 1.732,429 3,212,491 311,236 214,956 945 1,459,695 3,212,491 246,002 102,563 201,366 241,336 10,126 9,563 1.235,000 163,214 1.456.896 224,561 3.202.559 28,100 3,702,700 7,453 900 141,029 2,943,216 245,105 199,500 199,506 170,296 3,936,726 201,636 496,597 255,013 2,960,256 8,430,061 5,173,286 6,526,967 19,365 20.000 4,472,969 19.952 26,800 4,263,984 22,423,269 456,325 22.423,269 23.335,236 423,689 23,336,236 Net Income (oss) Weighted average number of common shares: FY 2018: Basic Diluted FY 2015: Basic Diluted 208,448,076 shares 210,348,076 shares 218,464,140 shares 220,964,140 shares
Step by Step Solution
There are 3 Steps involved in it

Get step-by-step solutions from verified subject matter experts