

Question: 1. Using the data from the class survey. Create the appropriate visual for the data provided below on excel. Work Hours Favorite Color Class Grade
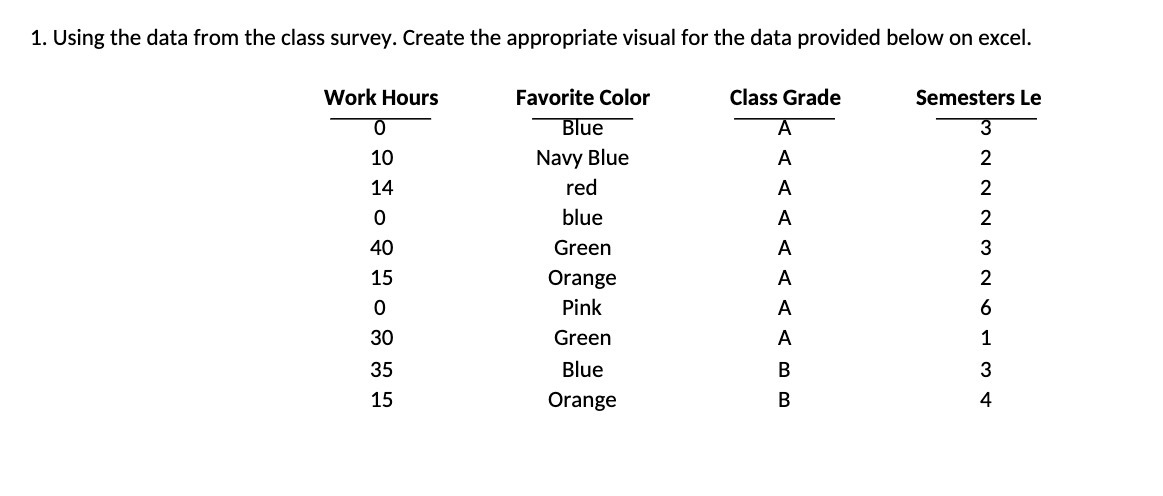
1. Using the data from the class survey. Create the appropriate visual for the data provided below on excel. Work Hours Favorite Color Class Grade Semesters Le 0 T Blue A 3 10 Navy Blue A 2 14 red A 2 0 blue A 2 40 Green A 3 15 Orange A 2 0 Pink A 6 30 Green A 1 35 Blue B 3 15 Orange B 4
Step by Step Solution
There are 3 Steps involved in it
1 Expert Approved Answer
Step: 1 Unlock

Question Has Been Solved by an Expert!
Get step-by-step solutions from verified subject matter experts
Step: 2 Unlock
Step: 3 Unlock