

Question: 1. Using the data in Table 1.1, what is the forecast for November if a 3-month moving average is used: a) 49.25 b) 50.67 53.00
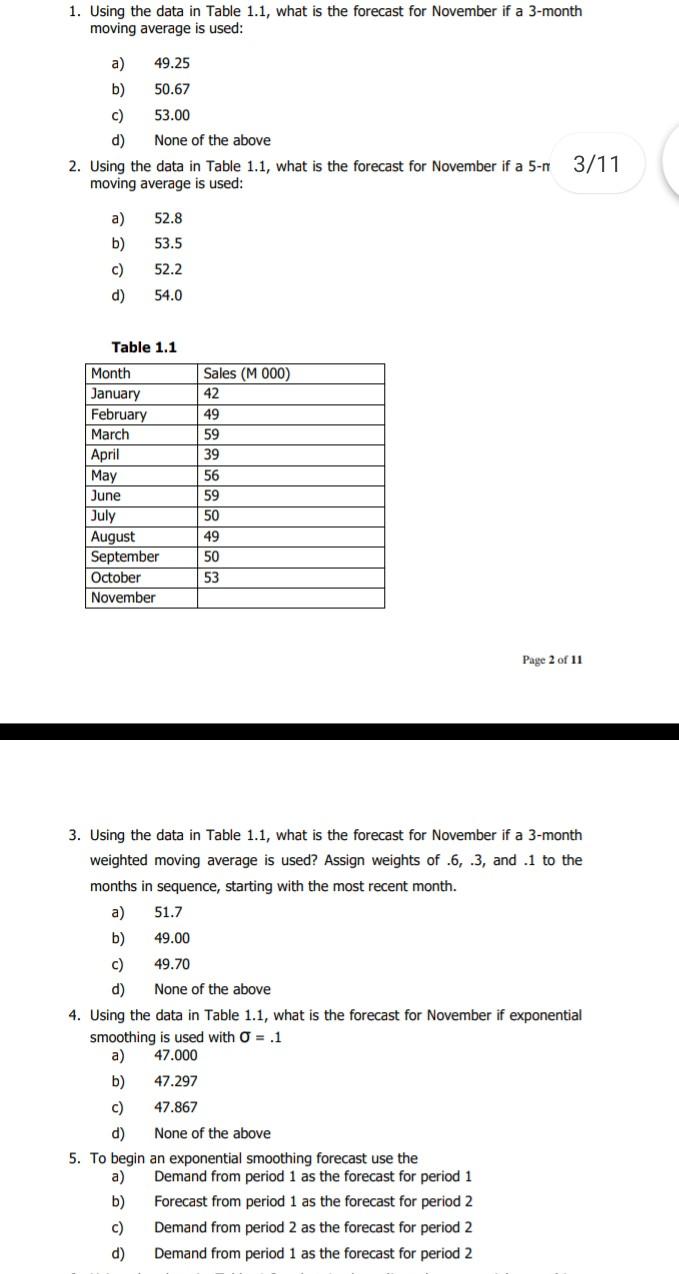
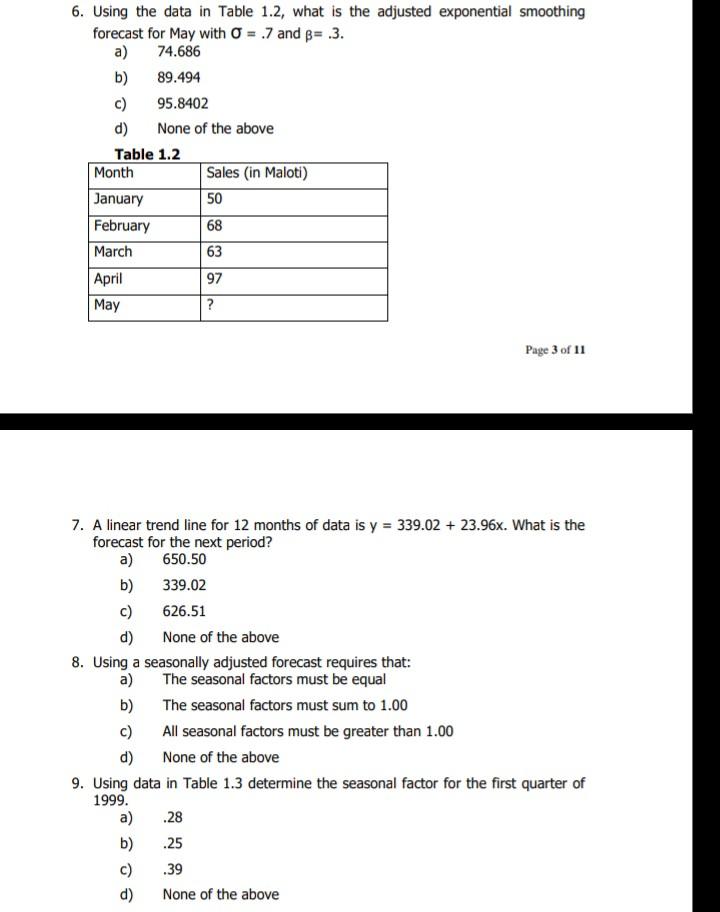
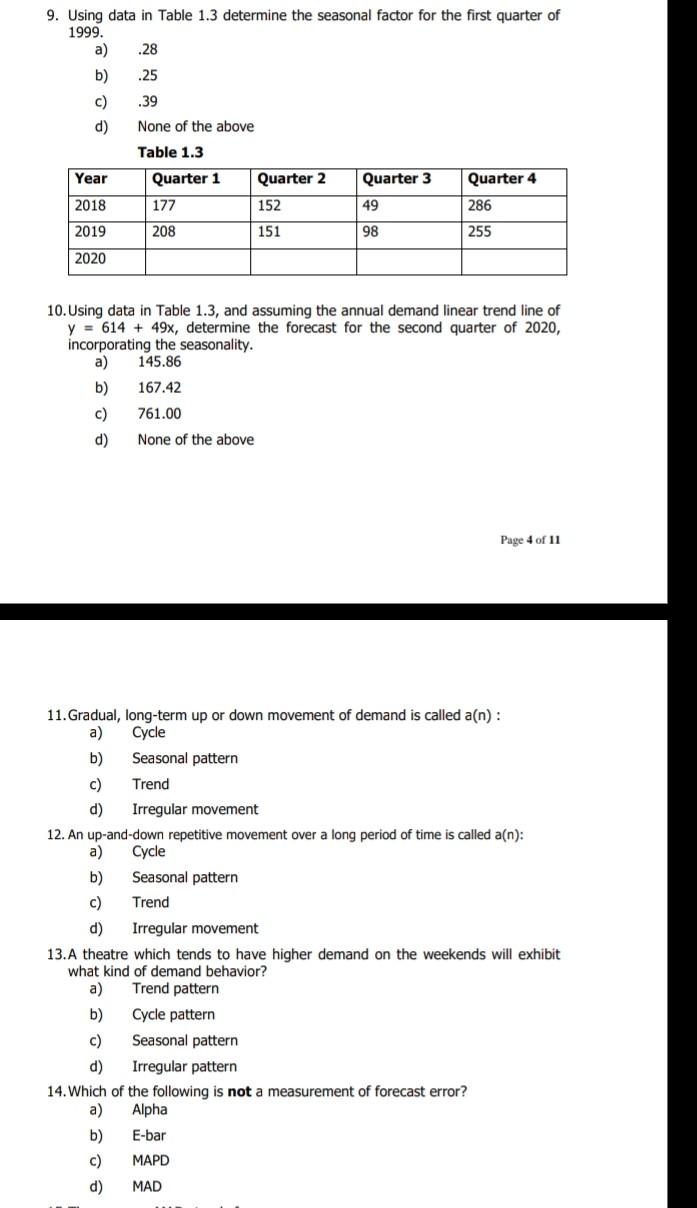
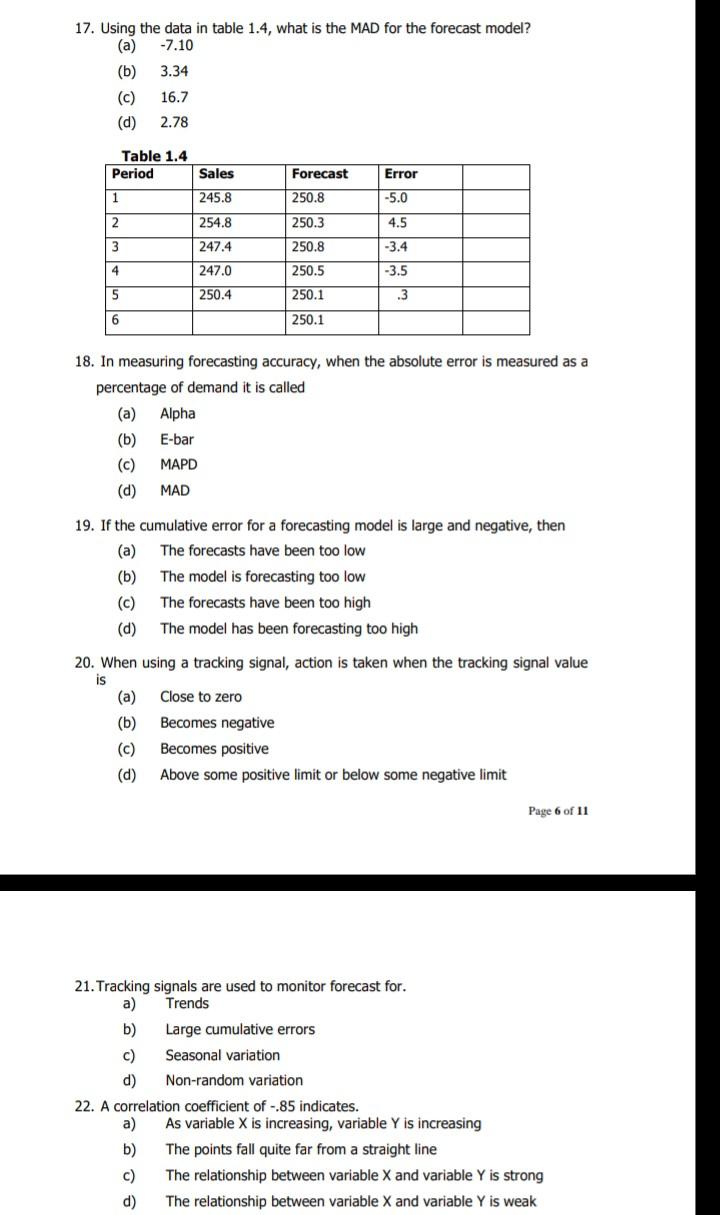
1. Using the data in Table 1.1, what is the forecast for November if a 3-month moving average is used: a) 49.25 b) 50.67 53.00 d) None of the above 2. Using the data in Table 1.1, what is the forecast for November if a 5-1 3/11 moving average is used: a) 52.8 b) 53.5 52.2 d) 54.0 Table 1.1 Sales (M 000) 42 Month January February March April May June July August September October November 49 59 39 56 59 50 49 50 53 Page 2 of 11 3. Using the data in Table 1.1, what is the forecast for November if a 3-month weighted moving average is used? Assign weights of .6, -3, and .1 to the months in sequence, starting with the most recent month. a) 51.7 b) 49.00 C) 49.70 d) None of the above 4. Using the data in Table 1.1, what is the forecast for November if exponential smoothing is used with = .1 a) 47.000 b) 47.297 47.867 d) None of the above 5. To begin an exponential smoothing forecast use the a) Demand from period 1 as the forecast for period 1 b) Forecast from period 1 as the forecast for period 2 c) Demand from period 2 as the forecast for period 2 Demand from period 1 as the forecast for period 2 6. Using the data in Table 1.2, what is the adjusted exponential smoothing forecast for May with 0 = 7 and 8=.3. a) 74.686 b) 89.494 c) 95.8402 d) None of the above Table 1.2 Month Sales in Maloti) January 50 February 68 March 63 April 97 May ? Page 3 of 11 7. A linear trend line for 12 months of data is y = 339.02 + 23.96x. What is the forecast for the next period? a) 650.50 b) 339.02 c) 626.51 d) None of the above 8. Using a seasonally adjusted forecast requires that: a) The seasonal factors must be equal b) The seasonal factors must sum to 1.00 c) All seasonal factors must be greater than 1.00 d) None of the above 9. Using data in Table 1.3 determine the seasonal factor for the first quarter of 1999. a) .28 b) .25 c) .39 d) None of the above 9. Using data in Table 1.3 determine the seasonal factor for the first quarter of 1999. a) .28 b) .25 c) .39 d) Year None of the above Table 1.3 Quarter 1 Quarter 2 177 152 208 151 Quarter 3 Quarter 4 286 2018 49 2019 98 255 2020 10. Using data in Table 1.3, and assuming the annual demand linear trend line of y = 614 + 49x, determine the forecast for the second quarter of 2020, incorporating the seasonality. a) 145.86 b) 167.42 c) 761.00 None of the above Page 4 of 11 11. Gradual, long-term up or down movement of demand is called a(n): a) Cycle b) Seasonal pattern c) Trend d) Irregular movement 12. An up-and-down repetitive movement over a long period of time is called a(n): a) Cycle b) Seasonal pattern c) Trend d) Irregular movement 13.A theatre which tends to have higher demand on the weekends will exhibit what kind of demand behavior? a) Trend pattern b) Cycle pattern c) Seasonal pattern d) Irregular pattern 14. Which of the following is not a measurement of forecast error? a) Alpha b) E-bar c) MAPD d) MAD 17. Using the data in table 1.4, what is the MAD for the forecast model? (a) -7.10 (b) 3.34 (c) 16.7 (d) 2.78 Table 1.4 Period Sales Error Forecast 250.8 1 245.8 -5.0 2 254.8 250.3 4.5 3 247.4 250.8 -3.4 4 247.0 250.5 -3.5 5 250.4 250.1 .3 6 250.1 18. In measuring forecasting accuracy, when the absolute error is measured as a percentage of demand it is called (a) Alpha (b) E-bar (c) MAPD (d) MAD 19. If the cumulative error for a forecasting model is large and negative, then (a) The forecasts have been too low (b) The model is forecasting too low The forecasts have been too high (d) The model has been forecasting too high 20. When using a tracking signal, action is taken when the tracking signal value is (a) Close to zero (b) Becomes negative (c) Becomes positive (d) Above some positive limit or below some negative limit Page 6 of 11 21. Tracking signals are used to monitor forecast for. a) Trends b) Large cumulative errors Seasonal variation d) Non-random variation 22. A correlation coefficient of -.85 indicates. a) As variable X is increasing, variable Y is increasing b) The points fall quite far from a straight line c) The relationship between variable X and variable Y is strong d) The relationship between variable X and variable Y is weak (a) (b) (c) (d) Alpha E-bar MAPD MAD 19. If the cumulative error for a forecasting model is large and negative, then (a) The forecasts have been too low (b) The model is forecasting too low (c) The forecasts have been too high (d) The model has been forecasting too high 20. When using a tracking signal, action is taken when the tracking signal value is (a) Close to zero (b) Becomes negative (C) Becomes positive (d) Above some positive limit or below some negative limit Page 6 of 11 21. Tracking signals are used to monitor forecast for. a) Trends b) Large cumulative errors c) Seasonal variation d) Non-random variation 22. A correlation coefficient of -85 indicates. a) As variable X is increasing, variable Y is increasing b) The points fall quite far from a straight line c) The relationship between variable X and variable Y is strong The relationship between variable X and variable Y is weak 23.A linear regression model indicates there is a high correlation between the 1 percentage of unemployment in a specific area and the demand for a certain product. If the correlation coefficient is -.843, what is the coefficient of determination? a) -.843 b) .711 c) 34.95% None of the above 24.A linear regression model indicates there is a high correlation between the percentage of unemployment in a specific area and the demand for a certain product. If the correlation coefficient is -,843, which of the following statements is true? a) As the unemployment rate declines, sales decline b) As the unemployment rate increases, the sales decrease As sales increase, the unemployment rate increases The relationship between the two variables weak 25. Variations in demand can be met by all of the following except (a) Using part-time workers (b) Backordering (c) Maintaining resources as is and using inventory for high demand levels (d) All of the above are ways to handle variations in demand
Step by Step Solution
There are 3 Steps involved in it
1 Expert Approved Answer
Step: 1 Unlock

Question Has Been Solved by an Expert!
Get step-by-step solutions from verified subject matter experts
Step: 2 Unlock
Step: 3 Unlock