

Question: 1. Using the data in the exhibit below, please calculate the following ratios for BMW. Has performance improved since the start of the pandemic, as
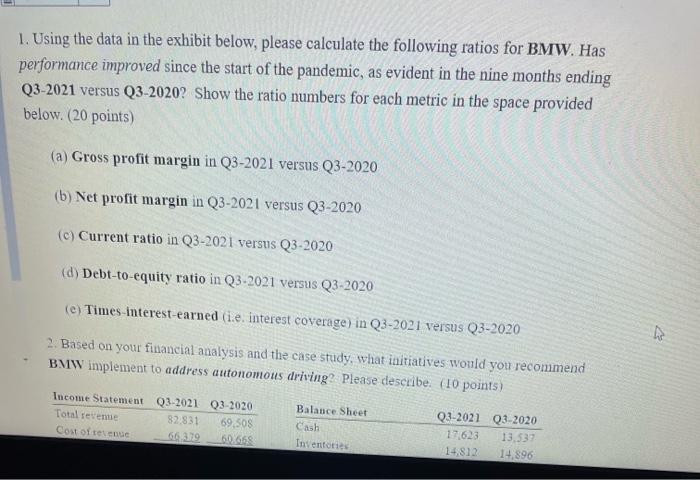
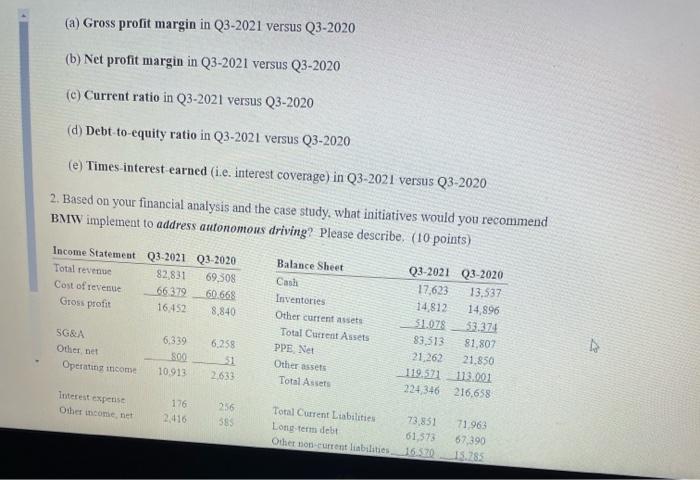
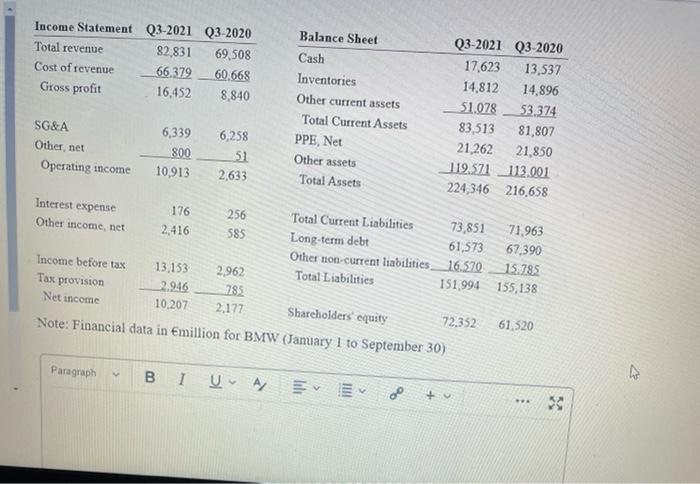
1. Using the data in the exhibit below, please calculate the following ratios for BMW. Has performance improved since the start of the pandemic, as evident in the nine months ending Q3-2021 versus Q3-2020? Show the ratio numbers for each metric in the space provided below. (20 points) (a) Gross profit margin in Q3-2021 versus Q3-2020 (b) Net profit margin in Q3-2021 versus Q3-2020 (c) Current ratio in Q3-2021 versus Q3-2020 (d) Debt-to-equity ratio in Q3-2021 versus Q3-2020 (e) Times-interest-earned (i.e. interest coverage) in Q3-2021 versus Q3-2020 2. Based on your financial analysis and the case study, what initiatives would you recommend BMW implement to address autonomous driving? Please describe. (10 points) Income Statement Total revenue Cost of revenue Q3-2021 Q3-2020 82.831 69,508 66.379 60.668 Balance Sheet Cash Inventories Q3-2021 Q3-2020 17,623 14,812 13,537 14,896 (a) Gross profit margin in Q3-2021 versus Q3-2020 (b) Net profit margin in Q3-2021 versus Q3-2020 (c) Current ratio in Q3-2021 versus Q3-2020 (d) Debt-to-equity ratio in Q3-2021 versus Q3-2020 (e) Times-interest-earned (i.e. interest coverage) in Q3-2021 versus Q3-2020 2. Based on your financial analysis and the case study, what initiatives would you recommend BMW implement to address autonomous driving? Please describe. (10 points) Income Statement Total revenue Cost of revenue Gross profit SG&A Other, net Operating income Interest expense Other income, net Q3-2021 Q3-2020 82,831 66.379 16,452 6,339 800 10.913 176 2,416 69,308 60.668 8,840 6,258 2,633 256 585 Balance Sheet Cash Inventories Other current assets Total Current Assets PPE Net Other assets Total Assets Q3-2021 Q3-2020 17,623 13,537 14,812 14,896 51.078 53.374 83,513 81,807 21,262 21,850 119.571 113.001 224,346 216,658 Total Current Liabilities 73,851 Long-term debt 61,57 Other non-current liabilities 16.570 71,963 67,390 15.285 D Income Statement Q3-2021 Q3-2020 Total revenue 82,831 69,508 Cost of revenue 66.379 60.668 Gross profit 16,452 8,840 SG&A Other, net Operating income Interest expense Other income, net 6,339 800 10,913 Paragraph V 176 2,416 6,258 51 2,633 256 585 Balance Sheet Cash BIU A/ Inventories Other current assets Total Current Assets PPE, Net Other assets Total Assets Income before tax 13,153 2,962 Tax provision 2.946 785 Net income 10,207 2,177 Shareholders' equity Note: Financial data in Emillion for BMW (January 1 to September 30) Total Current Liabilities Long-term debt Other non-current liabilities 16.570 Total Liabilities 151,994 M v Q3-2021 Q3-2020 17,623 13,537 14,812 14,896 51.078 53.374 83,513 81,807 21,262 21,850 119.571 113.001 224,346 216,658 2 73,851 71,963 61,573 67,390 15.785 155,138 72,352 61,520 www 30 4
Step by Step Solution
There are 3 Steps involved in it

Get step-by-step solutions from verified subject matter experts