

Question: Using the data in the table below, explain the equilibrium quantity and equilibrium price for a cellular telephone. Draw a graph to show equilibrium
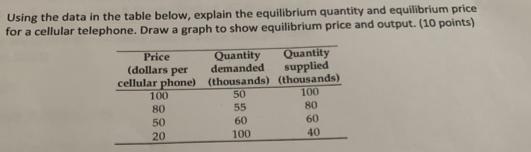
Using the data in the table below, explain the equilibrium quantity and equilibrium price for a cellular telephone. Draw a graph to show equilibrium price and output. (10 points) Price (dollars per Quantity Quantity supplied demanded cellular phone) (thousands) (thousands) 50 55 60 100 100 80 80 50 60 20 100 40
Step by Step Solution
★★★★★
3.46 Rating (149 Votes )
There are 3 Steps involved in it
1 Expert Approved Answer
Step: 1 Unlock

Question Has Been Solved by an Expert!
Get step-by-step solutions from verified subject matter experts
Step: 2 Unlock
Step: 3 Unlock