

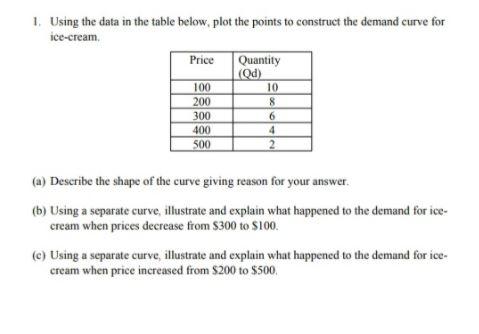
Question: 1. Using the data in the table below, plot the points to construct the demand curve for ice-cream Price Quantity (Qd) 100 200 300 400
Step by Step Solution
There are 3 Steps involved in it
1 Expert Approved Answer
Step: 1 Unlock

Question Has Been Solved by an Expert!
Get step-by-step solutions from verified subject matter experts
Step: 2 Unlock
Step: 3 Unlock