

Question: 1 . Using the dataset A 3 EU Organic Acreage create appropriate data visualisations showing: ( a ) the geographic variation in organic farming across
Using the dataset A EU Organic Acreage create appropriate data visualisations showing:
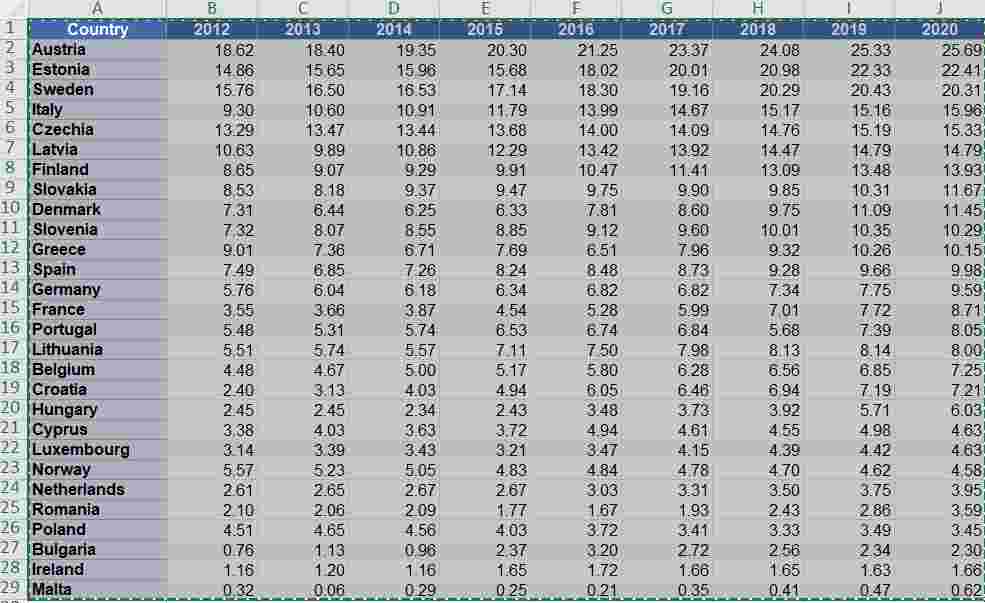
a the geographic variation in organic farming across the EUEEA countries in both and ;
b the variation over the whole time period and across the countries;
c suggest a form of visualisation that could combine the information in parts a and b above into one visualisation, even if that cant be made in Excel.
Country Austria Estonia Sweden Italy Czechia Latvia Finland Slovakia Denmark Slovenia Greece Spain Germany France Portugal Lithuania Belgium Croatia Hungary Cyprus Luxembourg Norway Netherlands Romania Poland Bulgaria Ireland Malta
Step by Step Solution
There are 3 Steps involved in it
1 Expert Approved Answer
Step: 1 Unlock

Question Has Been Solved by an Expert!
Get step-by-step solutions from verified subject matter experts
Step: 2 Unlock
Step: 3 Unlock