

Question: 1 Using the graph of the function f x in the diagram below a b C 17 16 15 14 134 12 11 10 9

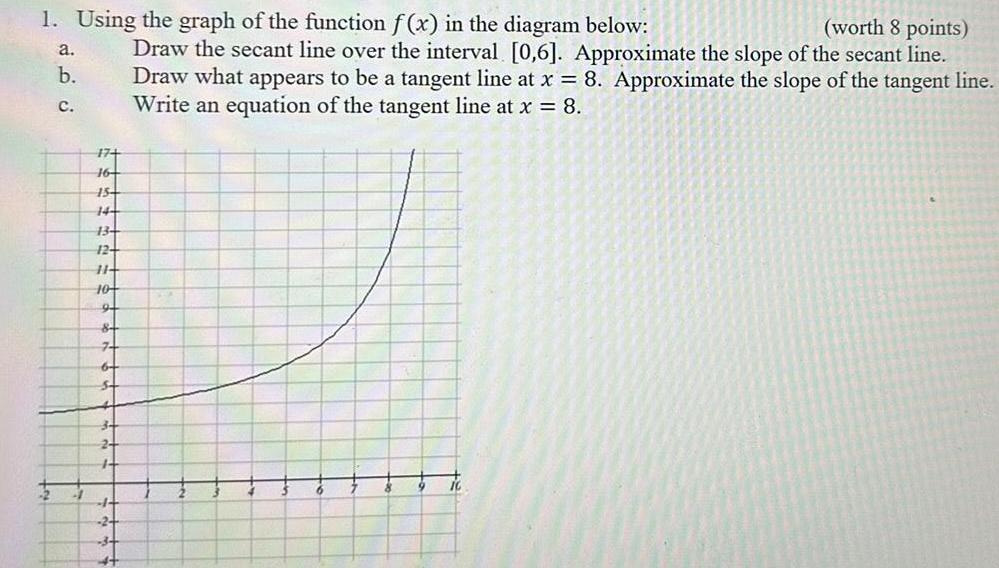
1 Using the graph of the function f x in the diagram below a b C 17 16 15 14 134 12 11 10 9 84 7 6 worth 8 points Draw the secant line over the interval 0 6 Approximate the slope of the secant line Draw what appears to be a tangent line at x 8 Approximate the slope of the tangent line Write an equation of the tangent line at x 8 2 1 4 10
Step by Step Solution
There are 3 Steps involved in it
1 Expert Approved Answer
Step: 1 Unlock

Question Has Been Solved by an Expert!
Get step-by-step solutions from verified subject matter experts
Step: 2 Unlock
Step: 3 Unlock