

Question: 1. Using the NMR spectra, create a prediction table showing shift, integrations, and splitting 2. Compare NMR spectra with what was expected. Are there any
1. Using the NMR spectra, create a prediction table showing shift, integrations, and splitting
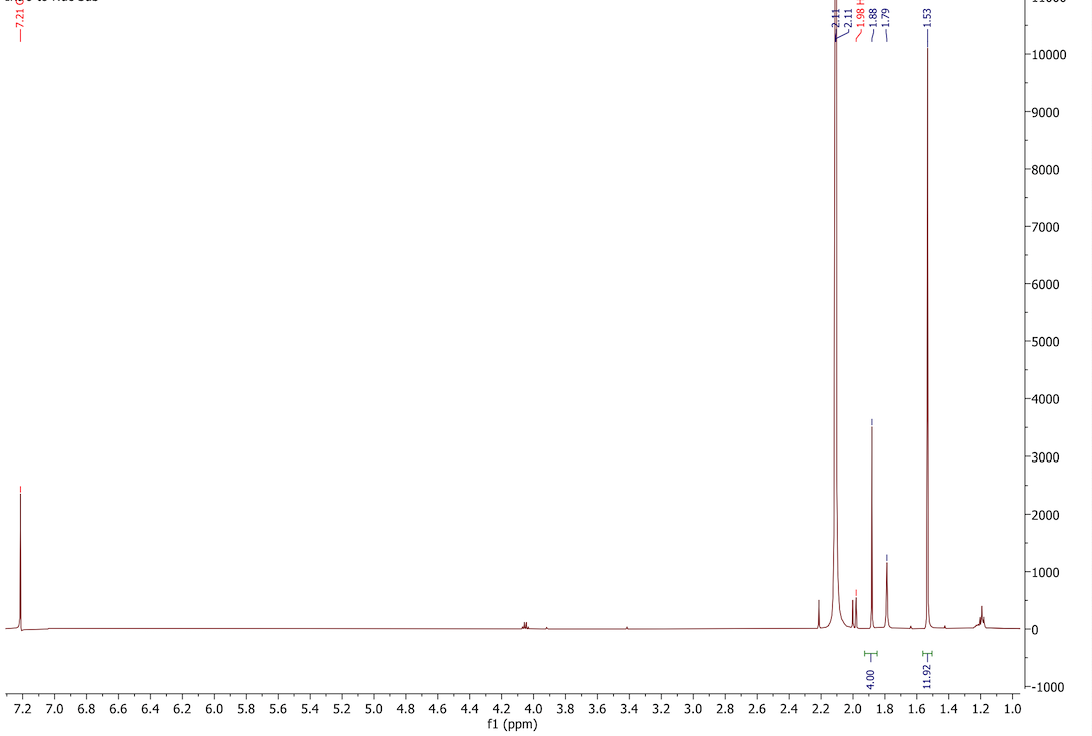
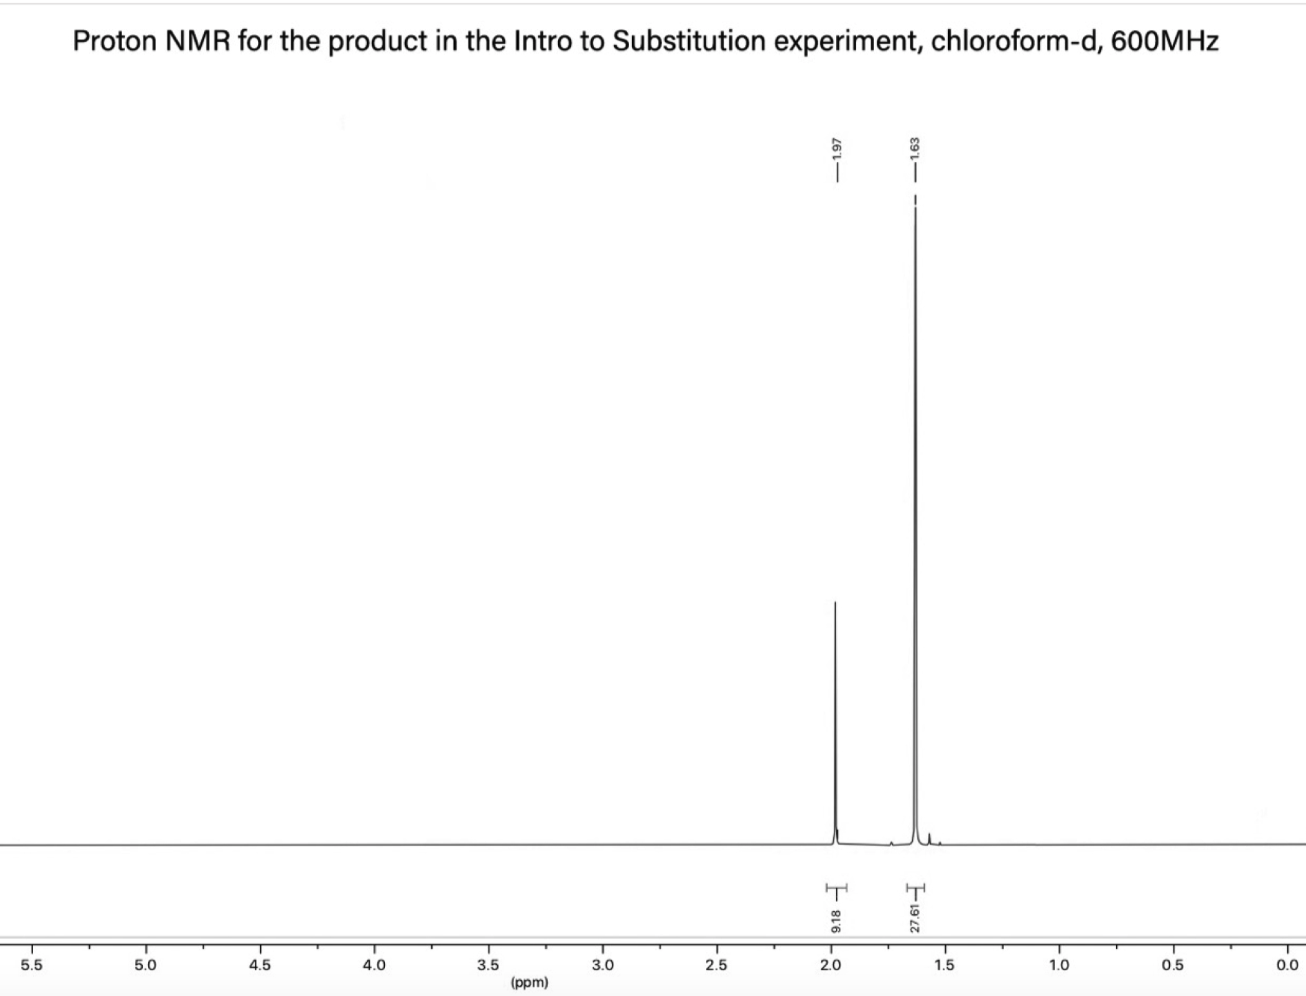
2. Compare NMR spectra with what was expected. Are there any contaminants?
NMR expected spectra
zoom into the picture
-7.21 1.98 -1.88 -1.79 -10000 -9000 -8000 7000 -6000 -5000 -4000 3000 +2000 +1000 -0 T T 5-761 7.2 7.0 6.8 .6 6.4 6.2 6.0 5.8 5.6 5.4 5.2 5.0 4.8 4.6 4.4 4.2 4.0 3.8 3.6 3.4 3.2 3.0 2.8 2.6 2.4 2.2 2.0 1.8 1.6 f1 (ppm) +-1000 1.4 1.2 1.0 Proton NMR for the product in the Intro to Substitution experiment, chloroform-d, 600MHz -1.97 -1.63 T T o 9.18 - 27.61-I 5.5 T 4.5 4.0 5.0 3.5 3.0 2.5 T 1.0 1.5 1 0.5 0.0 (ppm)
Step by Step Solution
There are 3 Steps involved in it
1 Expert Approved Answer
Step: 1 Unlock

Question Has Been Solved by an Expert!
Get step-by-step solutions from verified subject matter experts
Step: 2 Unlock
Step: 3 Unlock