

Question: 1. Using the ROE Model and the financial statements provided, fill out the table below. 2018 2017 2016 2015 ROE ROA Expense Ratio Interest Expense
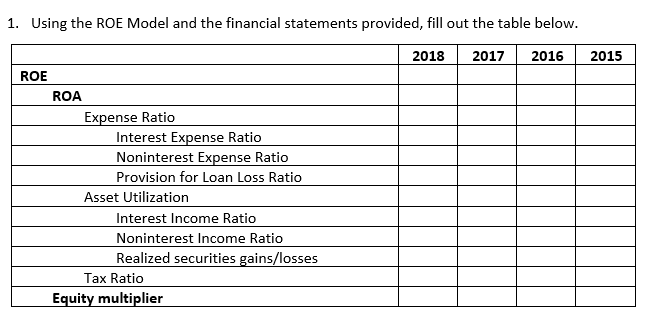
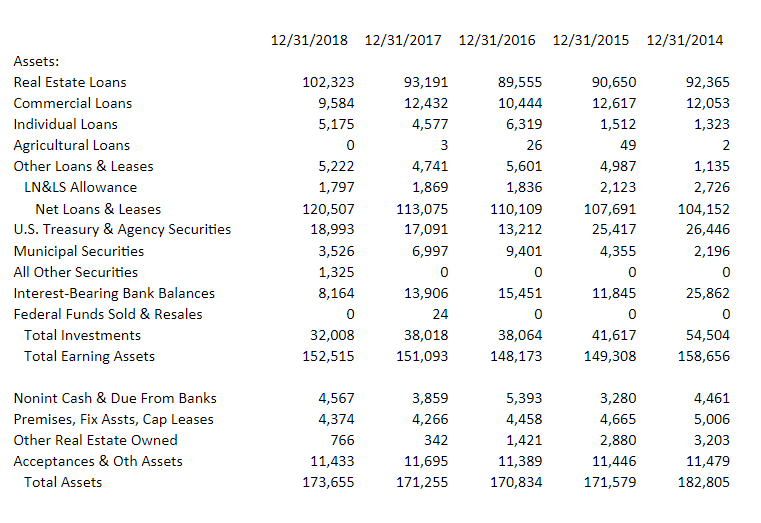
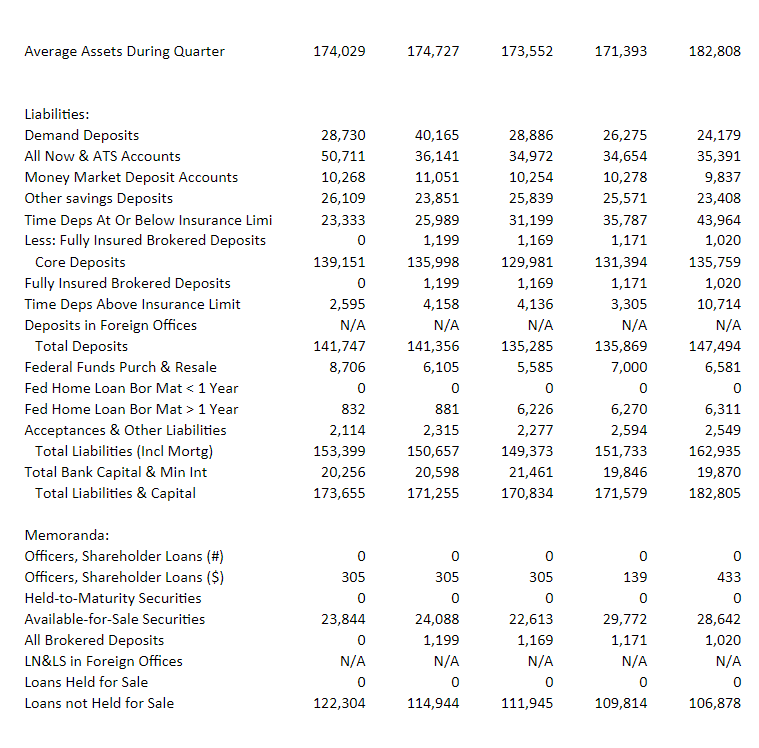
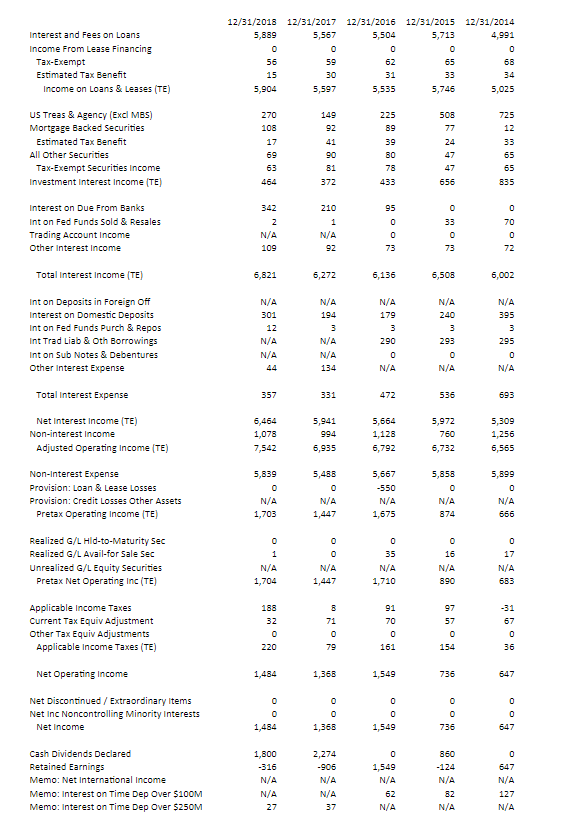
1. Using the ROE Model and the financial statements provided, fill out the table below. 2018 2017 2016 2015 ROE ROA Expense Ratio Interest Expense Ratio Noninterest Expense Ratio Provision for Loan Loss Ratio Asset Utilization Interest Income Ratio Noninterest Income Ratio Realized securities gains/losses Tax Ratio Equity multiplier 12/31/2018 12/31/2017 12/31/2016 12/31/2015 12/31/2014 Assets: Real Estate Loans Commercial Loans Individual Loans Agricultural Loans Other Loans & Leases LN&LS Allowance Net Loans & Leases U.S. Treasury & Agency Securities Municipal Securities All Other Securities Interest-Bearing Bank Balances Federal Funds Sold & Resales Total Investments Total Earning Assets 102,323 9,584 5,175 0 5,222 1,797 120,507 18,993 3,526 1,325 8,164 0 32,008 152,515 93,191 12,432 4,577 3 4,741 1,869 113,075 17,091 6,997 0 13,906 24 38,018 151,093 89,555 10,444 6,319 26 5,601 1,836 110,109 13,212 9,401 0 15,451 0 38,064 148,173 90,650 12,617 1,512 49 4,987 2,123 107,691 25,417 4,355 0 11,845 0 41,617 149,308 92,365 12,053 1,323 2 1,135 2,726 104,152 26,446 2,196 0 25,862 54,504 158,656 Nonint Cash & Due From Banks Premises, Fix Assts, Cap Leases Other Real Estate Owned Acceptances & Oth Assets Total Assets 4,567 4,374 766 11,433 173,655 3,859 4,266 342 11,695 171,255 5,393 4,458 1,421 11,389 170,834 3,280 4,665 2,880 11,446 171,579 4,461 5,006 3,203 11,479 182,805 Average Assets During Quarter 174,029 174,727 173,552 171,393 182,808 Liabilities: Demand Deposits All Now & ATS Accounts Money Market Deposit Accounts Other savings Deposits Time Deps At Or Below Insurance Limi Less: Fully Insured Brokered Deposits Core Deposits Fully Insured Brokered Deposits Time Deps Above Insurance Limit Deposits in Foreign Offices Total Deposits Federal Funds Purch & Resale Fed Home Loan Bor Mat 1 Year Acceptances & Other Liabilities Total Liabilities (Incl Mortg) Total Bank Capital & Min Int Total Liabilities & Capital 28,730 50,711 10,268 26,109 23,333 0 139,151 0 2,595 N/A 141,747 8,706 0 832 2,114 153,399 20,256 173,655 40,165 36,141 11,051 23,851 25,989 1,199 135,998 1,199 4,158 N/A 141,356 6,105 0 881 2,315 150,657 20,598 171,255 28,886 34,972 10,254 25,839 31,199 1,169 129,981 1,169 4,136 N/A 135,285 5,585 0 6,226 2,277 149,373 21,461 170,834 26,275 34,654 10,278 25,571 35,787 1,171 131,394 1,171 3,305 N/A 135,869 7,000 0 6,270 2,594 151,733 19,846 171,579 24,179 35,391 9,837 23,408 43,964 1,020 135,759 1,020 10,714 N/A 147,494 6,581 0 6,311 2,549 162,935 19,870 182,805 0 305 0 139 0 433 0 0 0 Memoranda: Officers, Shareholder Loans (#) Officers, Shareholder Loans ($) Held-to-Maturity Securities Available-for-Sale Securities All Brokered Deposits LN&LS in Foreign Offices Loans Held for Sale Loans not Held for Sale 0 305 0 23,844 0 N/A 0 122,304 24,088 1,199 N/A 0 114,944 305 0 22,613 1,169 N/A 0 111,945 29,772 1,171 N/A 0 109,814 28,642 1,020 N/A 0 106,878 Interest and Fees on Loans Income From Lease Financing Tax-Exempt Estimated Tax Benefit Income on Loans & Leases (TE) 12/31/2018 5,889 0 56 15 5,904 12/31/2017 12/31/2016 12/31/2015 5,567 5,504 5,713 0 59 62 65 30 31 33 5,597 5,535 5,746 12/31/2014 4.991 0 68 5,025 225 89 US Treas & Agency (Excl MBS) Mortgage Backed Securities Estimated Tax Benefit All Other Securities Tax-Exempt Securities income Investment Interest income (TE) 270 108 17 69 63 464 149 92 41 90 B1 372 508 77 24 47 39 80 78 433 725 12 33 65 65 47 656 835 95 0 0 33 Interest on Due From Banks Int on Fed Funds sold & Resales Trading Account Income Other interest income 342 2 N/A 109 210 1 N/A 92 0 0 73 70 0 72 73 6,821 6,272 6,136 6,506 6,002 N/A 395 Total Interest Income (TE) Int on Deposits in Foreign off Interest on Domestic Deposits Inton Fed Funds Purch & Repos Int Trad Liab & oth Borrowings Int on Sub Notes & Debentures Other interest Expense N/A 301 12 N/A N/A 44 N/A 194 3 N/A N/A 134 N/A 179 3 290 N/A 240 3 293 3 295 0 N/A 0 N/A N/A Total Interest Expense 357 331 472 536 693 Net Interest Income (TE) Non-interest Income Adjusted Operating Income (TE) 6,464 1,078 7,542 5,941 994 6,935 5,664 1,128 6,792 5,972 760 6,732 5,309 1,256 6,565 5,839 Non-Interest Expense Provision: Loan & Lease Losses Provision: Credit Losses Other Assets Pretax Operating Income (TE) 5,488 0 N/A 1,447 5,667 -550 N/A 1,675 5,858 0 N/A 874 5,899 0 N/A 666 N/A 1,703 0 1 0 17 0 35 N/A 1,710 N/A 1,704 N/A 1,447 16 N/A 890 N/A 683 Realized G/L Hid-to-Maturity Sec Realized G/L Avail-for Sale Sec Unrealized G/L Equity Securities Pretax Net Operating Inc (TE) Applicable Income Taxes Current Tax Equiv Adjustment Other Tax Equiv Adjustments Applicable Income Taxes (TE) 91 70 97 57 -31 67 188 32 0 220 B 71 0 79 0 0 161 154 36 Net Operating Income 1,484 1,368 1,549 736 647 Net Discontinued / Extraordinary Items Net Inc Noncontrolling Minority Interests Net Income o 1,368 0 0 1,549 0 0 736 0 0 647 1,484 Cash Dividends Declared Retained Earnings Memo: Net International Income Memo: Interest on Time Dep Over $100M Memo: Interest on Time Dep Over $250M 1,800 -316 N/A N/A 27 2,274 -906 N/A N/A 37 0 1,549 N/A 62 N/A 860 - 124 N/A 82 N/A 0 647 N/A 127 N/A 1. Using the ROE Model and the financial statements provided, fill out the table below. 2018 2017 2016 2015 ROE ROA Expense Ratio Interest Expense Ratio Noninterest Expense Ratio Provision for Loan Loss Ratio Asset Utilization Interest Income Ratio Noninterest Income Ratio Realized securities gains/losses Tax Ratio Equity multiplier 12/31/2018 12/31/2017 12/31/2016 12/31/2015 12/31/2014 Assets: Real Estate Loans Commercial Loans Individual Loans Agricultural Loans Other Loans & Leases LN&LS Allowance Net Loans & Leases U.S. Treasury & Agency Securities Municipal Securities All Other Securities Interest-Bearing Bank Balances Federal Funds Sold & Resales Total Investments Total Earning Assets 102,323 9,584 5,175 0 5,222 1,797 120,507 18,993 3,526 1,325 8,164 0 32,008 152,515 93,191 12,432 4,577 3 4,741 1,869 113,075 17,091 6,997 0 13,906 24 38,018 151,093 89,555 10,444 6,319 26 5,601 1,836 110,109 13,212 9,401 0 15,451 0 38,064 148,173 90,650 12,617 1,512 49 4,987 2,123 107,691 25,417 4,355 0 11,845 0 41,617 149,308 92,365 12,053 1,323 2 1,135 2,726 104,152 26,446 2,196 0 25,862 54,504 158,656 Nonint Cash & Due From Banks Premises, Fix Assts, Cap Leases Other Real Estate Owned Acceptances & Oth Assets Total Assets 4,567 4,374 766 11,433 173,655 3,859 4,266 342 11,695 171,255 5,393 4,458 1,421 11,389 170,834 3,280 4,665 2,880 11,446 171,579 4,461 5,006 3,203 11,479 182,805 Average Assets During Quarter 174,029 174,727 173,552 171,393 182,808 Liabilities: Demand Deposits All Now & ATS Accounts Money Market Deposit Accounts Other savings Deposits Time Deps At Or Below Insurance Limi Less: Fully Insured Brokered Deposits Core Deposits Fully Insured Brokered Deposits Time Deps Above Insurance Limit Deposits in Foreign Offices Total Deposits Federal Funds Purch & Resale Fed Home Loan Bor Mat 1 Year Acceptances & Other Liabilities Total Liabilities (Incl Mortg) Total Bank Capital & Min Int Total Liabilities & Capital 28,730 50,711 10,268 26,109 23,333 0 139,151 0 2,595 N/A 141,747 8,706 0 832 2,114 153,399 20,256 173,655 40,165 36,141 11,051 23,851 25,989 1,199 135,998 1,199 4,158 N/A 141,356 6,105 0 881 2,315 150,657 20,598 171,255 28,886 34,972 10,254 25,839 31,199 1,169 129,981 1,169 4,136 N/A 135,285 5,585 0 6,226 2,277 149,373 21,461 170,834 26,275 34,654 10,278 25,571 35,787 1,171 131,394 1,171 3,305 N/A 135,869 7,000 0 6,270 2,594 151,733 19,846 171,579 24,179 35,391 9,837 23,408 43,964 1,020 135,759 1,020 10,714 N/A 147,494 6,581 0 6,311 2,549 162,935 19,870 182,805 0 305 0 139 0 433 0 0 0 Memoranda: Officers, Shareholder Loans (#) Officers, Shareholder Loans ($) Held-to-Maturity Securities Available-for-Sale Securities All Brokered Deposits LN&LS in Foreign Offices Loans Held for Sale Loans not Held for Sale 0 305 0 23,844 0 N/A 0 122,304 24,088 1,199 N/A 0 114,944 305 0 22,613 1,169 N/A 0 111,945 29,772 1,171 N/A 0 109,814 28,642 1,020 N/A 0 106,878 Interest and Fees on Loans Income From Lease Financing Tax-Exempt Estimated Tax Benefit Income on Loans & Leases (TE) 12/31/2018 5,889 0 56 15 5,904 12/31/2017 12/31/2016 12/31/2015 5,567 5,504 5,713 0 59 62 65 30 31 33 5,597 5,535 5,746 12/31/2014 4.991 0 68 5,025 225 89 US Treas & Agency (Excl MBS) Mortgage Backed Securities Estimated Tax Benefit All Other Securities Tax-Exempt Securities income Investment Interest income (TE) 270 108 17 69 63 464 149 92 41 90 B1 372 508 77 24 47 39 80 78 433 725 12 33 65 65 47 656 835 95 0 0 33 Interest on Due From Banks Int on Fed Funds sold & Resales Trading Account Income Other interest income 342 2 N/A 109 210 1 N/A 92 0 0 73 70 0 72 73 6,821 6,272 6,136 6,506 6,002 N/A 395 Total Interest Income (TE) Int on Deposits in Foreign off Interest on Domestic Deposits Inton Fed Funds Purch & Repos Int Trad Liab & oth Borrowings Int on Sub Notes & Debentures Other interest Expense N/A 301 12 N/A N/A 44 N/A 194 3 N/A N/A 134 N/A 179 3 290 N/A 240 3 293 3 295 0 N/A 0 N/A N/A Total Interest Expense 357 331 472 536 693 Net Interest Income (TE) Non-interest Income Adjusted Operating Income (TE) 6,464 1,078 7,542 5,941 994 6,935 5,664 1,128 6,792 5,972 760 6,732 5,309 1,256 6,565 5,839 Non-Interest Expense Provision: Loan & Lease Losses Provision: Credit Losses Other Assets Pretax Operating Income (TE) 5,488 0 N/A 1,447 5,667 -550 N/A 1,675 5,858 0 N/A 874 5,899 0 N/A 666 N/A 1,703 0 1 0 17 0 35 N/A 1,710 N/A 1,704 N/A 1,447 16 N/A 890 N/A 683 Realized G/L Hid-to-Maturity Sec Realized G/L Avail-for Sale Sec Unrealized G/L Equity Securities Pretax Net Operating Inc (TE) Applicable Income Taxes Current Tax Equiv Adjustment Other Tax Equiv Adjustments Applicable Income Taxes (TE) 91 70 97 57 -31 67 188 32 0 220 B 71 0 79 0 0 161 154 36 Net Operating Income 1,484 1,368 1,549 736 647 Net Discontinued / Extraordinary Items Net Inc Noncontrolling Minority Interests Net Income o 1,368 0 0 1,549 0 0 736 0 0 647 1,484 Cash Dividends Declared Retained Earnings Memo: Net International Income Memo: Interest on Time Dep Over $100M Memo: Interest on Time Dep Over $250M 1,800 -316 N/A N/A 27 2,274 -906 N/A N/A 37 0 1,549 N/A 62 N/A 860 - 124 N/A 82 N/A 0 647 N/A 127 N/A
Step by Step Solution
There are 3 Steps involved in it

Get step-by-step solutions from verified subject matter experts